The widening gap between Spain's house prices
House prices have risen considerably in recent years and the first signs of overvaluation are starting to appear in cities such as Madrid and Barcelona, as well as some tourist spots. But the situation is very different in less urban areas, where the recovery in the real estate sector began later and is much slower. As a result, regional divergences in the price and affordability of housing are widening.

After the sharp fall in house prices between 2008 and 2014 (30.7% nominal and 37.2% in real terms)1, a new expansionary cycle began for the real estate market in 2015 characterised by a high degree of geographical heterogeneity, as we shall see later. However, before examining how the price of housing has evolved in different areas and localities, it is useful to review the key figures at a national level, as these will serve as a reference for further analysis.
The price of housing beganto increase in 2015, according to data from the Ministry of Development (based on appraisal prices). From its minimum value in Q3 2014 to the most recent data, corresponding to Q3 2019, it accumulated growth of 12.3% (8.6% in real terms). Despite this upward trend, the price is still approximately 22% below its all-time high (-31.8% in real terms). On the other hand, the housing price index published by the INE (based on transaction prices)2 indicates a more vigorous recovery, with a nominal advance of 30.4% between Q1 2014 and Q2 2019 (24.7% in real terms), although the distance separating this from the pre-crisis peak is similar to the one indicated by the data from the Ministry of Public Works3 (-18.2% below the maximum in nominal terms, -30.6% in real terms).
- 1. In this article, unless otherwise indicated, we use the price of housing published by the Ministry of Public Works as this is published by province and for municipalities with more than 25,000 inhabitants.
- 2. INE house prices have been published since 2007, nationally and by autonomous community.
- 3. This is because INE house prices fell more sharply between 2007 and 2014 (-37.2% nominal and -44.3% real) than the Ministry of Public Works prices.
The price of housing has picked up in the last five years although it is still 22% lower than the peak reached before the crisis and is very heterogeneous in geographical terms
Based on the trend in house prices since 2014, we have classified the Spanish provinces into four groups:
- Leaders: Madrid, Barcelona, the Balearic Islands, Malaga, Santa Cruz de Tenerife and Las Palmas make up the group that is leading the recovery in the real estate market, provinces containing major cities and well-established tourist destinations. Here the price of housing began to recover earlier and has grown more vigorously (27.8% between Q1 2014 and Q3 2019, well above the national figure of 12.3%).
- Advanced: Cadiz, Granada, Seville, Zaragoza, Valladolid, Guadalajara, Girona, Tarragona, Alicante, Valencia, Caceres, La Coruña and Navarre. In these provinces we find important cities in terms of population, tourism and economic activity. Here the recovery took longer to get going and price growth is positive but more modest (6.3% between Q1 2014 and Q3 2019).
- Followers: This group contains almost half of Spain's provinces (Almeria, Cordoba, Huelva, Huesca, Asturias, Cantabria, Burgos, Palencia, Salamanca, Albacete, Toledo, Lleida, Castellón, Badajoz, Lugo, Orense, Pontevedra, Murcia, Álava, Guipúzcoa and La Rioja). This is a fairly heterogeneous group, made up of provinces that are located in the so-called «abandoned Spain» and others that are still digesting the excesses of the real estate boom. Here house prices are still very close to their minimum, although they have been posting positive growth rates for a few quarters.
- Taking off: Jaen, Teruel, Ávila, Leon, Segovia, Soria, Zamora, Ciudad Real, Cuenca and Vizcaya. These are provinces where house prices are still at or very close to their minimum.
House prices are recovering at different speeds
Index (100 = Q1 2014)
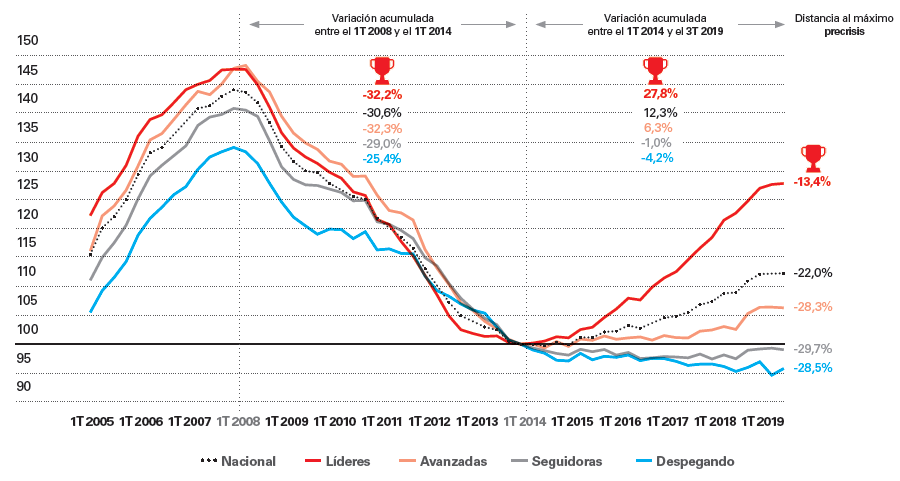
As a result of this recovery at different speeds, prices across the different regions are diverging and the gap between the most expensive and cheapest provinces is widening. The leading provinces (where house prices have risen the most) were already among the most expensive in 2014 whereas the group of followers and the group of those that are taking off are made up of provinces with the lowest price (both in 2014 and 2019), with the notable exceptions of Vizcaya and Guipúzcoa4.
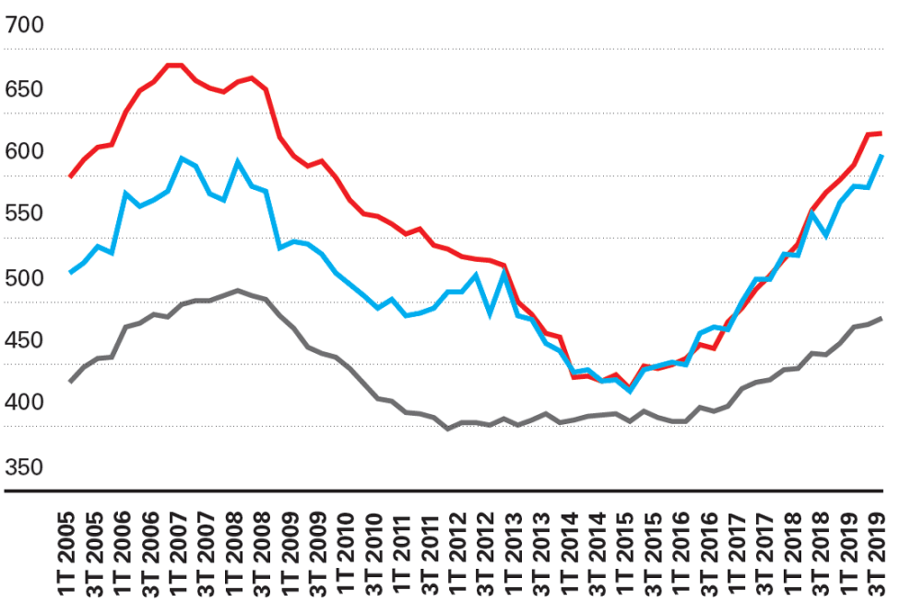
This divergence is even more pronounced between cities. The spread in house prices has increased across the different provincial capitals, as shown in the chart below (on the left). This trend is even more pronounced if we include all municipalities with over 25,000 inhabitants5.
On the other hand, price divergence within provinces is also increasing, as shown in the right-hand chart6. This is particularly true in the leader provinces, where prices in the major cities have grown much more than in the rest of the cities in the same province. The most extreme case is the city of Ibiza, where the price of housing grew by 52.6% between Q1 2014 and Q3 2019 while, in the Balearic Islands as a whole, the increase was also considerable (26.6%) but clearly lower than the Ibizan capital.
- 4. Formally, the regression coefficient is significant and positive, at the level of province, for the variation in house prices between Q1 2014 and Q3 2019 on the price of housing in 2014. In other words, there is evidence of beta divergence; i.e. house prices in provinces with a higher initial price grow faster, so that price differences become more pronounced. There is also a positive regression coefficient for provincial capitals and in municipalities with over 25,000 inhabitants.
- 5. In other words, there is evidence of sigma divergence; i.e. over time, the spread in price levels (estimated via the standard deviation) increases within a group of provinces or cities.
- 6. Here we refer to sigma divergence. As for beta divergence, evidence supporting this hypothesis has only been found for the Balearic Islands, Barcelona and Alicante. For the rest of the provinces, the coefficient is not significant.
The gap between the most expensive and cheapest provinces and cities is widening. In 2019, buying a home in Barcelona or the Spanish capital costs more than double the national average, while in 2014 it was «only» 1.6 times more
The spread between prices across provinces and municipalities is increasings
(standard deviation of house prices)
The spread between prices across municipalities in the same province is increasing
(standard deviation of house prices across municipalities in each province) *
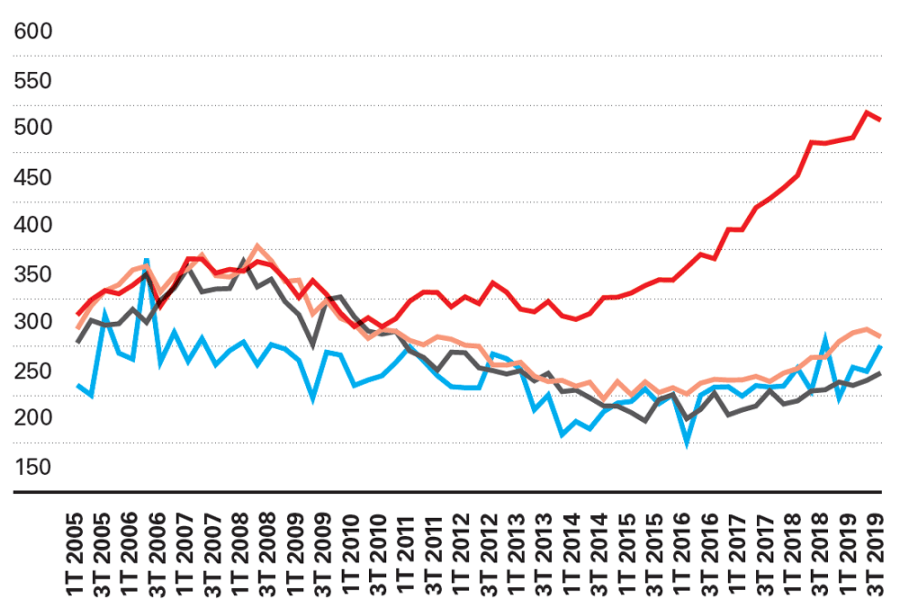
In the rest of the tourist provinces that make up the group of leaders (Malaga and the two Canary Island provinces), this pattern of strong growth in house prices was also observed in other cities that are highly attractive for tourists. For example, in the province of Malaga, those cities with the greatest house price growth since 2014 are Benalmádena (57.5%), Fuengirola (53.5%) and Rincón de la Victoria (50.7%), outperforming Malaga city (37.1%) and Malaga province (24.5%).
Barcelona and Madrid saw their pattern change in 2019 after several years of above-average growth compared with the average for their respective provicines7. Madrid house prices grew by 7.0% year-on-year in Q3 2019 compared to 4.6% for the Community of Madrid as a whole, whereas other municipalities in the province reported much higher growth rates, especially Parla (14.0%) and Getafe (11.3%) (24.5%).
- 7. In the municipalities of the province of Barcelona and Madrid there is evidence to support beta convergence in the past year; i.e. in 2019, house prices in these provinces have grown more than in those cities with the lowest price level in 2018.
Price divergence within provinces has also increased, as shown by the Balearic Islands: the city of Ibiza is the second most expensive place to buy a home in Spain, after San Sebastian
This «oil stain» that spreads from the capital to the surrounding towns can also be observed in the province of Barcelona. In Barcelona city and Sant Cugat del Vallès (the most expensive city in Barcelona province after the capital), the price of housing grew more moderately (3.4% and 2.2% year-on-year in Q3 2019, respectively) compared with increases of over 10% in the around surrounding Barcelona city (Santa Coloma de Gramenet, Badalona, L'Hospitalet de Llobregat, etc.).
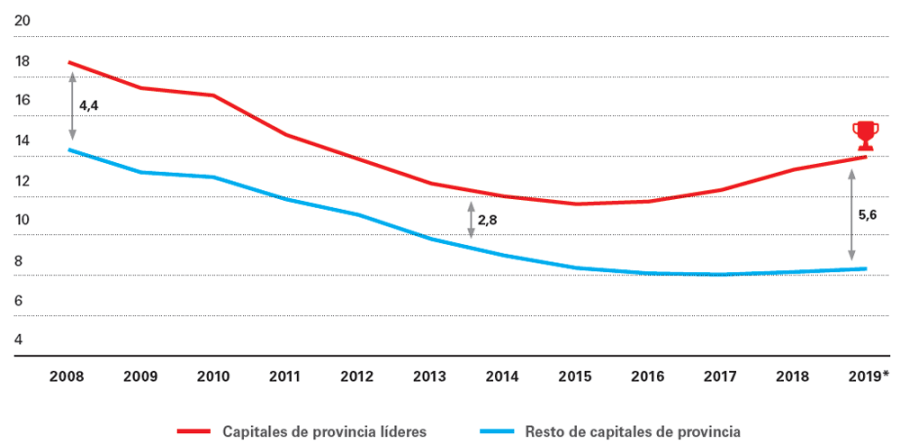
The sharp rise in house prices since 2014 in the cities of the leader provinces has also pushed down affordability ratios; i.e. the effort required for households to buy housing8. Although household income in these cities has grown more than the national average, as these locations are also the most dynamic in terms of economic activity and tourism, this increase in income has not been enough to offset the rise in house prices. As a result, affordability ratios in the six capitals of the leading provinces (Madrid, Barcelona, Malaga, Palma de Mallorca, Las Palmas de Gran Canaria and Santa Cruz de Tenerife), which were already among the highest in Spain, have grown more than in the rest of the provincial capitals. In other words, the divergence between prices has been passed on to the affordability ratios, as can be seen in the chart below.
- 8. We have calculated the affordability ratios for housing in provincial capitals as the price per square metre provided by the Ministry of Public Works multiplied by 93.75 m2 (average surface area of housing according to the Bank of Spain) divided by the median household income. Income by city has been taken from CaixaBank's own data and takes into account wages, pensions and unemployment benefit.
The sharp rise in real estate prices in cities has pushed up housing affordability ratios; a Madrid household needs twice as many years of income to buy a home compared to household in Granada
This increase in the affordability ratio, more pronounced in those cities that were already relatively unaffordable, has reopened debate on whether prices reflect the fundamental value of housing or whether, on the contrary, the market is overvalued (the article «What is happening in the European real estate market?» in this Sector Report, examines the trend in house prices and affordability ratios in European cities).
Affordability ratio in provincial capitals
(years of median household income)
In order to assess whether housing is overpriced, the Bank of Spain has developed several indicators and models which, despite being based on aggregate data and subject to a high degree of uncertainty, serve as an indication to monitor the possible deviation of house prices with respect to values that could be considered equilibrium. Specifically, the Bank of Spain uses four indicators of imbalance. Two of these are gaps calculated as the difference between the value of the interest rate variable in each period and its long-term trend for (i) house prices in real terms and (ii) the ratio of house prices to household disposable income. The other two indicators are based on somewhat more complex econometric models9. Note that these indicators use the disposable income of households resident in Spain and therefore take into account the purchasing power of the local population. This point will be discussed later.
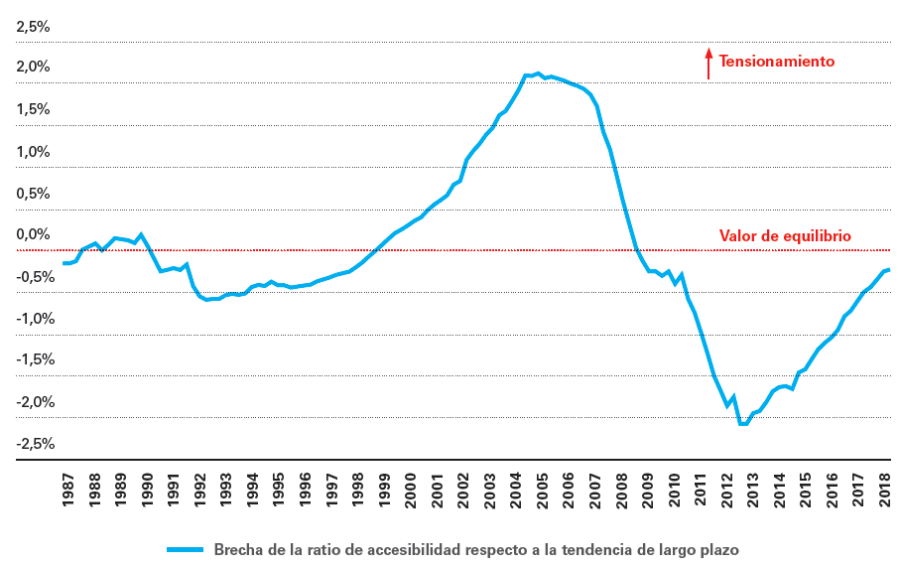
According to the Bank of Spain's own estimates, the price of housing at a national level is currently close to equilibrium. In fact, some of the components of the house price equilibrium indicator already scored slightly positive values in the first half of 2019, although the average remained very close to the equilibrium10. In this article, we use the second of the aforementioned indicators, based on the affordability ratio gap. The trend in this indicator, which can be seen in the following chart, shows that the price of housing in Spain as a whole is effectively approaching its equilibrium value.
- 9. In particular, the third indicator of imbalance is based on a regression of house prices, in real terms, related to household disposable income and mortgage interest rates. The fourth is based on an error correction model in which, in the long term, house prices in real terms depend on household disposable income and mortgage interest rates. Long-term trends are obtained using a Hodrick-Prescott filter from a tail with a smoothing parameter equal to 400,000. See the «Financial Stability Report» from Autumn 2019 for more details.
- 10. Other estimates, such as that of the European Central Bank or the Federal Reserve in Dallas, also suggest that house prices in Spain are close to their equilibrium value, with some indicators already showing slight overvaluation.
Housing is not overvalued at a national level but in Barcelona, Madrid and the Balearic Islands the price is above equilibrium
The national affordability ratio is close to equilibrium
(pps)
If we apply the methodology developed by the Bank of Spain in our estimates of the affordability ratio at the level of autonomous community, we find that only three (Madrid, Catalonia and the Balearic Islands) have figures higher than the equilibrium value and four other communities (Basque Country, Navarre, La Rioja and the Canary Islands) would be slightly above their equilibrium value. At a municipal level, we can only reconstruct a sufficiently long historical series of house prices for the cities of Madrid and Barcelona. In both cases these estimates suggest that house prices have become decoupled from the trend in household income, resulting in notable tension in affordability ratios for the local population.
Gap between the domestic affordability ratio compared with its long-term trend in autonomous communities
(pps)

In large cities there are signs of house prices decoupling from local income
These findings may give rise to some uncertainty about the possibility of price correction in the most stressed areas. However, it is important to remember that, as already mentioned, affordability ratios only take into account the purchasing power of domestic demand. In those cases where other types of demand for housing are significant (foreigners, investors, etc.), buyers which, in many cases, have a greater purchasing power than the average local population, it is possible that the affordability indicators for domestic housing may be above their equilibrium value. In this respect, whether prices in the most stressed areas can be corrected will depend partly on the trend in non-domestic demand. The main forecasting scenario of CaixaBank Research predicts a moderation in the growth rate of house prices but no abrupt price adjustment is expected in large cities. In particular, forecasts for the trend in real estate at a municipal level11 point to the current expansion continuing, supported by increasing urbanisation which will continue to attract talent to the most dynamic cities, and also by these cities remaining very attractive for international investors.
- 11. Forecasts based on a hierarchical model that combines an ARIMA model to capture trends over time and a GBM model to capture demographic dynamics, population movements, economic activity and tourism.
- 1. In this article, unless otherwise indicated, we use the price of housing published by the Ministry of Public Works as this is published by province and for municipalities with more than 25,000 inhabitants.
- 2. INE house prices have been published since 2007, nationally and by autonomous community.
- 3. This is because INE house prices fell more sharply between 2007 and 2014 (-37.2% nominal and -44.3% real) than the Ministry of Public Works prices.
- 4. Formally, the regression coefficient is significant and positive, at the level of province, for the variation in house prices between Q1 2014 and Q3 2019 on the price of housing in 2014. In other words, there is evidence of beta divergence; i.e. house prices in provinces with a higher initial price grow faster, so that price differences become more pronounced. There is also a positive regression coefficient for provincial capitals and in municipalities with over 25,000 inhabitants.
- 5. In other words, there is evidence of sigma divergence; i.e. over time, the spread in price levels (estimated via the standard deviation) increases within a group of provinces or cities.
- 6. Here we refer to sigma divergence. As for beta divergence, evidence supporting this hypothesis has only been found for the Balearic Islands, Barcelona and Alicante. For the rest of the provinces, the coefficient is not significant.
- 7. In the municipalities of the province of Barcelona and Madrid there is evidence to support beta convergence in the past year; i.e. in 2019, house prices in these provinces have grown more than in those cities with the lowest price level in 2018.
- 8. We have calculated the affordability ratios for housing in provincial capitals as the price per square metre provided by the Ministry of Public Works multiplied by 93.75 m2 (average surface area of housing according to the Bank of Spain) divided by the median household income. Income by city has been taken from CaixaBank's own data and takes into account wages, pensions and unemployment benefit.
- 9. In particular, the third indicator of imbalance is based on a regression of house prices, in real terms, related to household disposable income and mortgage interest rates. The fourth is based on an error correction model in which, in the long term, house prices in real terms depend on household disposable income and mortgage interest rates. Long-term trends are obtained using a Hodrick-Prescott filter from a tail with a smoothing parameter equal to 400,000. See the «Financial Stability Report» from Autumn 2019 for more details.
- 10. Other estimates, such as that of the European Central Bank or the Federal Reserve in Dallas, also suggest that house prices in Spain are close to their equilibrium value, with some indicators already showing slight overvaluation.
- 11. Forecasts based on a hierarchical model that combines an ARIMA model to capture trends over time and a GBM model to capture demographic dynamics, population movements, economic activity and tourism.


