
Spanish firms’ profitability and financing costs
In our previous article dedicated to analysing the evolution of investment in Spain, we focused on describing the pattern of investment by type of asset and by sector, and on comparing it with the euro area. In this second article, we want to focus on incentives for investment.

In the previous Focus of this Monthly Report dedicated to analysing the evolution of investment in Spain, we focused on describing the pattern of investment by type of asset and by sector, and on comparing it with the euro area. In this article, we want to focus on incentives for investment.
To this end, we will analyse, sector by sector, the evolution of the gap between return on assets and financing costs.1 Intuitively, if this gap widens, we ought to see greater investment, and vice versa. For this purpose, we use information from the quarterly reports produced by the Bank of Spain’s Central Balance Sheet Data Office, which provide data on profitability and financing cost up until Q1 2024.2
The first chart shows the change in the gap between profitability and financing costs for the economy as a whole, for the energy, industrial and services sectors, as well as for a set of service subsectors. The grey bars show the change between the average gap during the period 2015-2019 and the average gap in 2020-2023.3 The blue dots show the change between the 2015-2019 average and 2023, which offers us a picture of where the gap lay in the most recent year for which data is available, as well as the year most affected by the ECB’s interest rate hikes.4
- 1Return on assets is defined as:
\(\frac{(Ordinary\;net\;profit\;+\;finance\;costs)}{(Net\;assets\;+\;market-price\;adjustment)}\)
Ordinary net profit is gross value added, less staff costs, net finance costs, depreciation and amortisation and operating provisions. Net assets includes own funds plus external resources at cost.
Finance costs are defined as the financial costs of external resources
at cost. - 2We take data from the quarterly reports produced by the Central Balance Sheet Data Office (CBT), rather than the Integrated version (CBI), which has more representative data, because the CBI data is only available up until 2022 and thus they do not reflect the impact of the rate hikes of 2023. The CBT data reach up until Q1 2024. We have used the available historical data to compare the evolution of the variables considered by the CBT and the CBI. Although there are differences in level and in volatility, the trends are similar in both sources.
- 3We take the 2020-2023 average in order to capture both the declines in profitability witnessed during the COVID-19 pandemic and the subsequent recoveries.
- 4As an example, the average gap between profitability and financing costs during the period 2015-2019 was 6.4 pps for industry. In the period 2020-2023, the average gap deteriorated by 2.6 pps (grey bar), so it went on to present an average gap of 3.8 pps.

For the total of all sectors, we can see that the average gap in the period 2020-2023 remains slightly below the pre-pandemic level of 2015-2019, although the difference is very small. However, at the individual sector level we see a much more varied picture. Whereas the energy sector shows an average gap in 2020-2023 that far exceeds its pre-pandemic level, thanks to the rise in energy prices during this period, we see that the average gap in services, and above all in industry, still lies well below the pre-pandemic level. In the case of industry, even in 2023 there are still no signs of a recovery of the gap. The picture within the services sector is also highly varied: whereas in the trade and hospitality, the transport and the information and telecommunications sectors we see that the gap between profits and financing costs still lies well below pre-pandemic levels, in the other categories of services the gap has already recovered to the average pre-pandemic level.
However, not all sectors have the same share of capital investment. In this regard, the evolution of the gap between profitability and financing costs is most relevant for the sectors with the greatest relative weight in total investment. In descending order, of particular note is the manufacturing industry, which in 2019 accounted for 19.4% of total capital investment; this is followed by the trade and hospitality sector, which accounted for 14.4%, and the transport and storage sector, with 13.9%. These three sectors combined represent almost 50% of all capital investment, sand in all of them the return on assets has deteriorated relative to the pre-pandemic period.5
It is also interesting to investigate whether the variations in the gap between profitability and finance costs are due to changes in the former or in the latter. To this end, the last chart breaks down the difference between the gap in 2023 and the 2015-2019 average according to changes in profitability (grey bars) and changes in financing costs (blue bars).
- 5The information in the CBT does not allow the trade sector to be disaggregated from the hospitality sector. Furthermore, the figures may be dominated by the trade segment, which accounted for 70% of this category according to National Accounting data for 2022, compared to 30% in the case of hospitality. Also, according to the CBI, in 2022 the gap between profitability and financing costs in the trade and hospitality sector had already reached the pre-pandemic level of 2019.
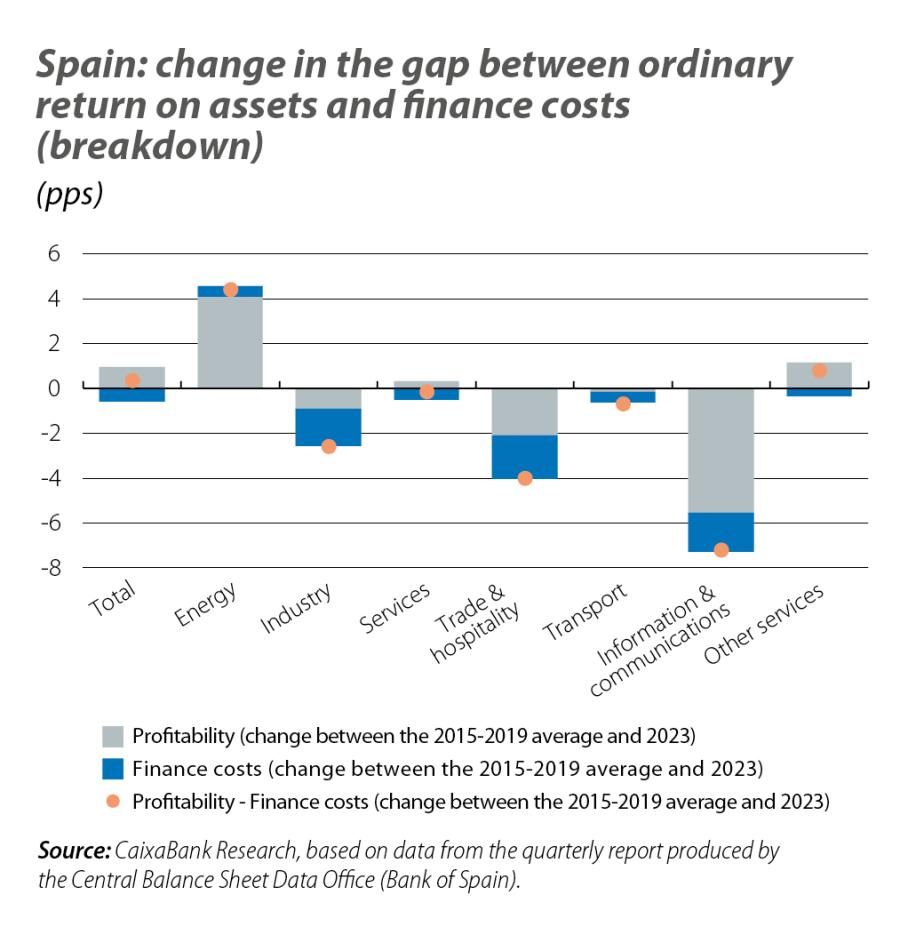
The chart shows that the increase in the cost of financing accounts for over half of the reduction in the gap in 2023 compared to 2015-2019 for the manufacturing industry and the transport sector, and half of the reduction in the case of the trade and hospitality sector. These gaps are expected to improve in 2024 and 2025 as the ECB continues to lower interest rates.
Conclusions
In the average of 2020 and 2023, the gap between the return on assets and the cost of financing for the economy as a whole has suffered only a slight decrease compared to the average in the period 2015-2019. However, the sectors that are more intensive in capital investment have experienced a more pronounced narrowing of the gap between profitability and finance costs, while in some cases, such as industry, there is still no sign of recovery. This deterioration in the gap is due both to a fall in profitability and to rising financing costs, the latter being linked to the cycle of monetary policy tightening which the ECB embarked on in mid-2022.
The deterioration in the gap between profitability and financing costs may be adversely affecting firms’ investment decisions, although we expect that this narrowing will reverse slightly over the coming quarters as interest rates continue to fall.