Productivity growth in Europe: low, uneven and slowing
Increasing productivity growth is one of the major challenges that Europe faces. As stated in the introductory article of this Dossier, «Europe’s moment: it is time to bolster our competitiveness», it is urgent to update the productive fabric of Europe’s economy. Rapid technological change allows this. Moreover, the global context, which is increasingly competitive and with a growing distrust of multilateral institutions, makes it imperative.

Productivity has grown steadily in the EU over the past two decades. The average annual growth of GDP per hour worked1 between the year 2000 and 2022 was 1.2%, and negative growth rates were only observed in 2008 and 2009, in the midst of the global financial crisis. Thus, in 2022 productivity was 26.6% higher than in the year 2000.
- 1. To calculate the rate of productivity growth, GDP is used at constant prices of 2015 per hour worked in order to eliminate the effect of inflation and obtain a measure of productivity growth in real terms.
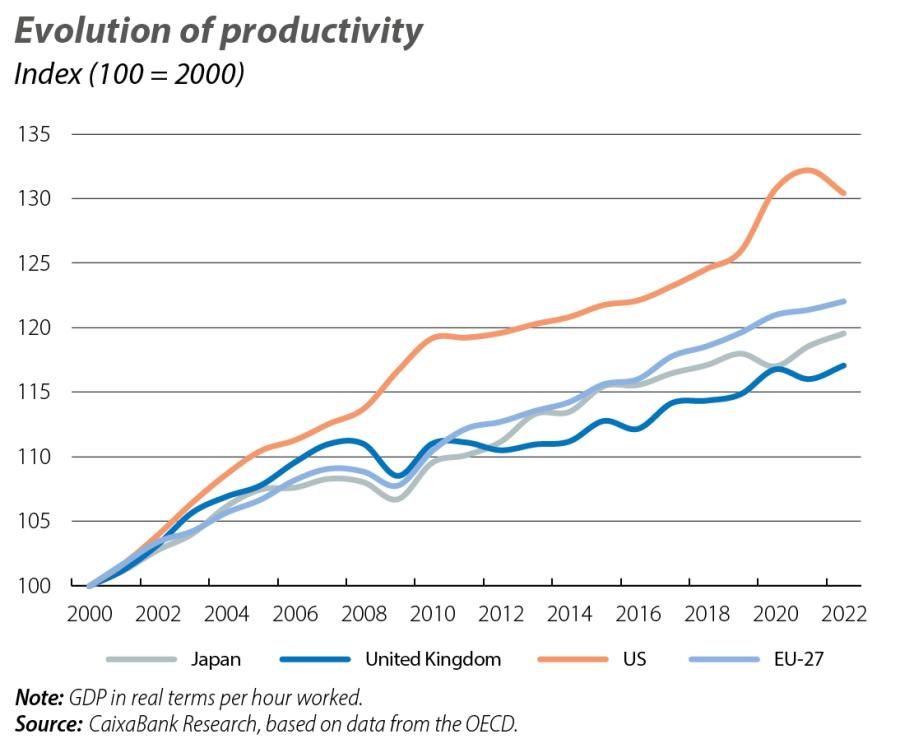
However, it should be noted that the rate at which productivity is growing has slowed in recent years. Across the EU as a whole, productivity grew by an average of 1.9% per year between 2000 and 2006. In contrast, since the financial crisis, the pace of growth has slowed significantly. Between 2007 and 2022, average annual growth stood at 0.9%. Declining productivity growth is a pervasive phenomenon in the major developed economies. In the US, productivity has gone from growing by 2.4% to 1.3%; in the UK, from 1.8% to 0.4%; and in Japan, from 1.5% to 0.8%.
These figures also reveal another element: productivity growth in the EU has been lower than in the US economy over the last few decades. The difference may seem small: it is just 0.4 pps lower between the years 2000 and 2022, on average. However, as the difference in growth persists for many years, the implications end up being significant: the gap between the productivity of the European economy and that of the US has widened by 8.4% since the year 2000.
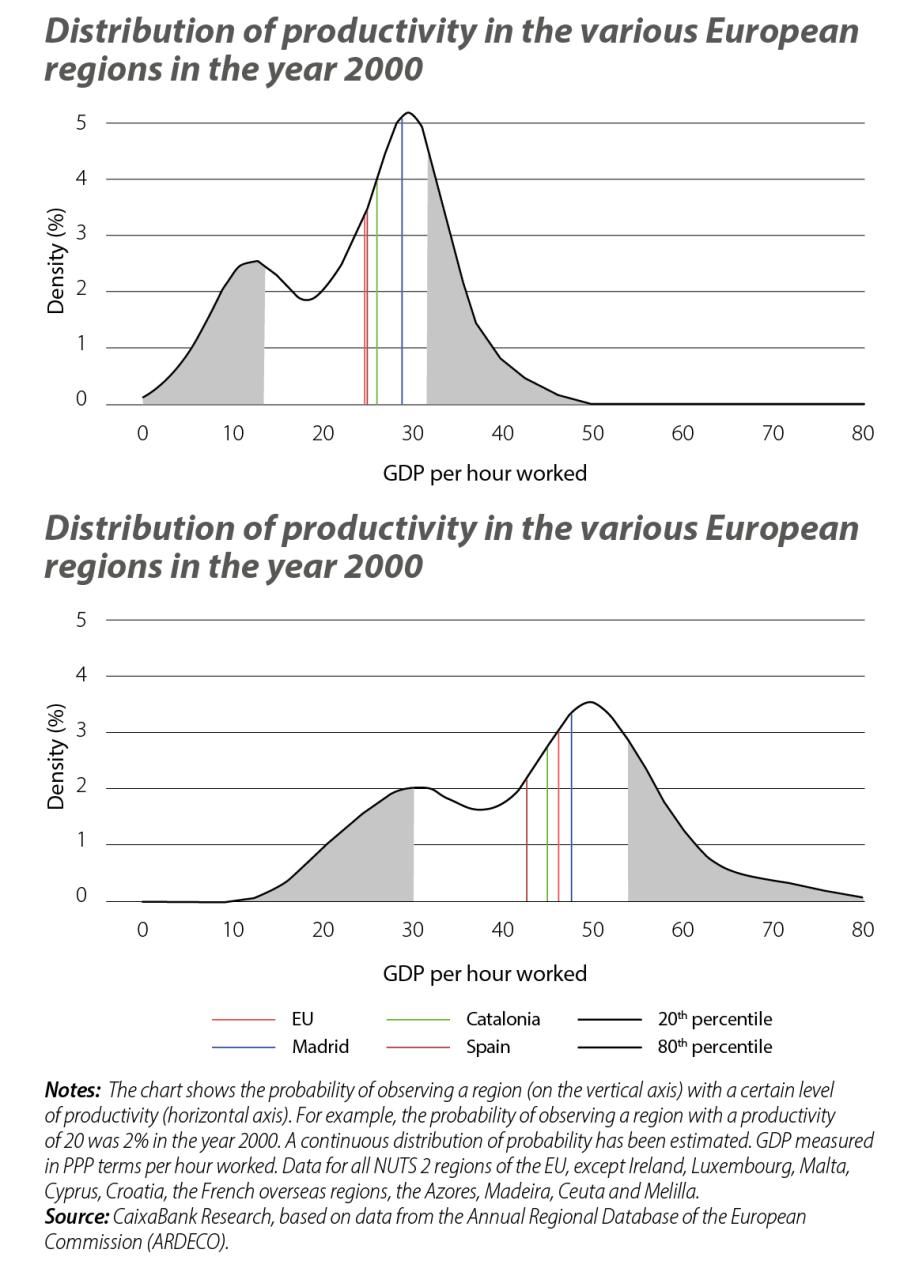
Analyzing the state of productivity in the various European regions helps us understand the figures for the EU as a whole. As shown in the second chart, the distribution of productivity is concentrated at two different points. There is a first group of regions with a relatively low level of productivity, and a second group of regions with a higher level. The peak of the first group lies around the first quintile of the distribution, which in the year 2000 is at a level of GDP per hour worked of 13.6 euros. The peak of the second group corresponds, also closely, to the 80th percentile of the distribution, with a GDP per hour worked of 31.4 euros. In between these two groups is where all Spanish regions lie.2
In recent decades, the growth in regions with lower productivity levels has not been strong enough to narrow the gap between them in absolute terms; in fact, it is quite the contrary. The gap between the first group of regions (the least productive) and the group formed by the most productive regions has actually widened over the last two decades. Specifically, the first quintile increased to 30.1 euros in 2022 and the 80th percentile stood at 53.8. Thus, the distance between the two mountains has widened by 5.9 euros, or 33.4%.3
The belt of regions that begins in Denmark, the Netherlands and Belgium, and runs down through Germany to Austria, is the one that has strengthened the most in recent years (see third chart). This group of countries accounts for 82% of the regions that were in the highest productivity range in 2022, while in 2000 this figure stood at 75%. Seen differently, 48% of the regions in these countries were in the top 20 most productive regions in 2022, while in 2000 this was the case for «only» 43% of them.
- 2. For a more detailed analysis, see «Evolución de la productividad en Europa: una mirada regional», at www.cercledeconomia.com.
- 3. The distance between the 80th percentile and the 20th percentile widened between 2000 and 2022, regardless of whether the evolution of the distribution of GDP per hour worked is analysed in real terms or adjusted for PPP.
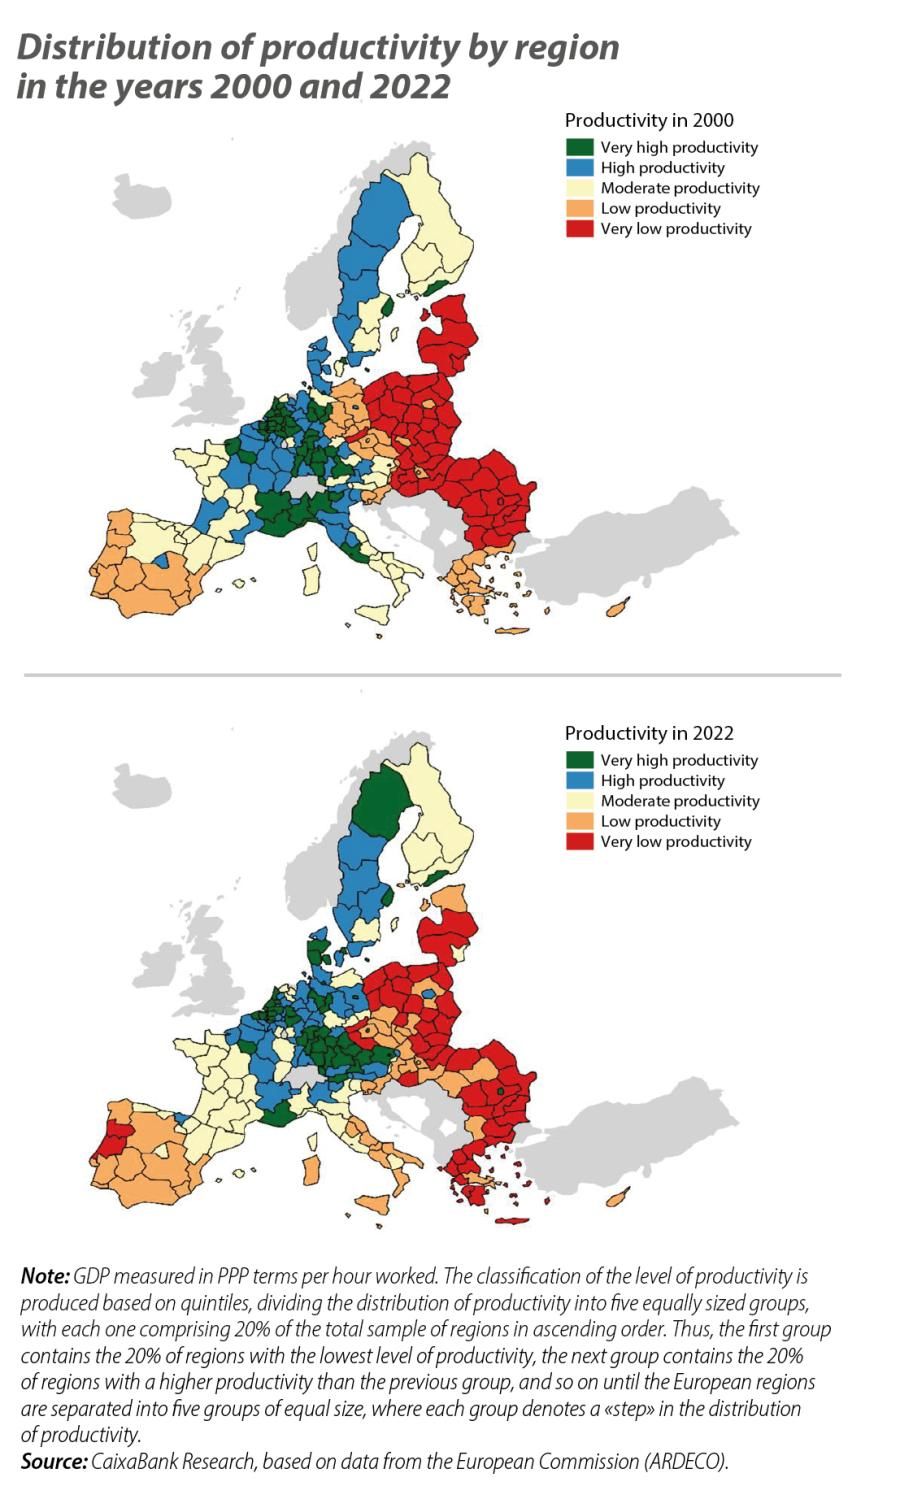
In contrast, many of the French and Italian regions have lost dynamism in recent years. Italy had five regions in the highest productivity group in the year 2000, whereas by 2022 it had only one, namely the autonomous province of Bolzano, and the country’s southern regions have moved to a low level of productivity. France has only two regions left with a very high level of productivity, and the number of regions in the high productivity range has declined.
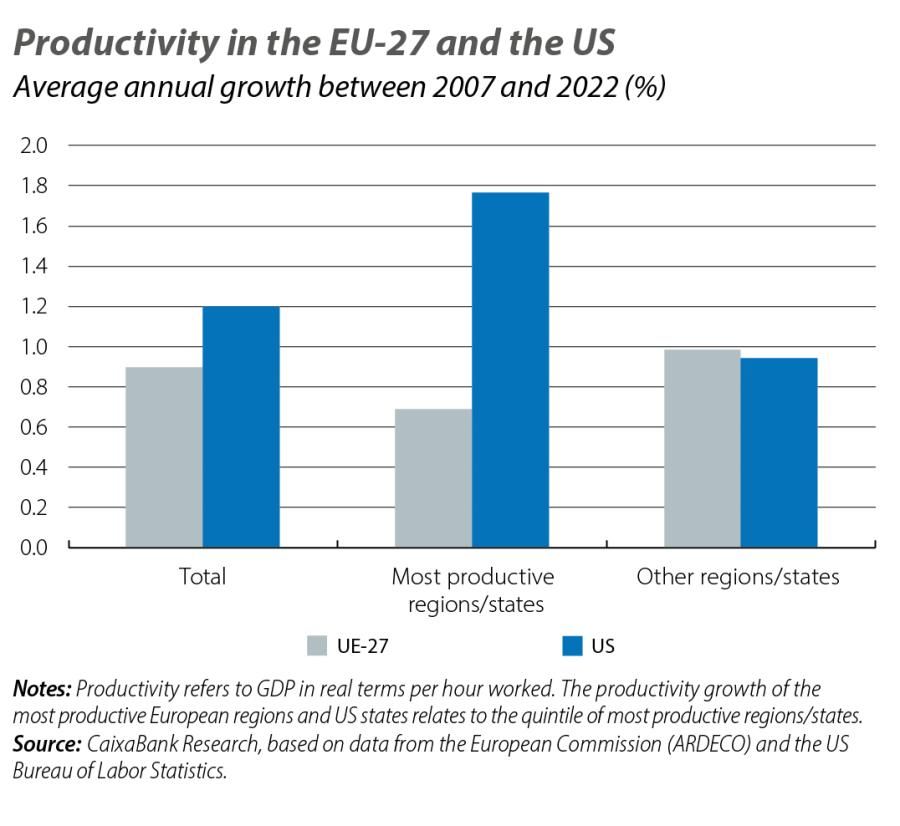
However, productivity growth in the most productive European regions has been modest compared to the improvement experienced by the most productive US states.4 As can be seen in the fourth chart, the difference is significant: between 2007 and 2022, on average, growth was 1.1 pp higher. In contrast, US productivity growth without these regions is quite similar to that of the rest of the European regions.
- 4. The most productive quintile of US states, which includes California, New York and Massachusetts, accounts for 31% of US GDP. The quintile of the most productive European regions accounts for 29% of Europe’s GDP.
As for the Spanish regions, in 2000 the majority (58.82%, specifically) were in the middle section of the distribution (in the third quintile of the productivity distribution), while Madrid had high productivity and the remaining regions of the country had low productivity. In general, the regions of the northern half are in the moderate productivity group, while those of the southern half are in the low productivity group. Between 2000 and 2022, there are three regions that dropped down to the low productivity level, such that most regions, specifically 52.9%, fall into this group in 2022. The Community of Madrid ends up in the moderate productivity group and the Basque Country is the only region to climb up a level, becoming part of the high productivity group.
In the lower part of the distribution, of particular note is the collapse of the regions of Greece, which now find themselves at the tail end of the distribution of European productivity. Indeed, 78.6% of the regions falling from quintile 2 to 1 are Greek. In contrast, all the regions that climb from quintile 1 to 2 correspond to different countries in Eastern Europe.
- 1. To calculate the rate of productivity growth, GDP is used at constant prices of 2015 per hour worked in order to eliminate the effect of inflation and obtain a measure of productivity growth in real terms.
- 2. For a more detailed analysis, see «Evolución de la productividad en Europa: una mirada regional», at www.cercledeconomia.com.
- 3. The distance between the 80th percentile and the 20th percentile widened between 2000 and 2022, regardless of whether the evolution of the distribution of GDP per hour worked is analysed in real terms or adjusted for PPP.
- 4. The most productive quintile of US states, which includes California, New York and Massachusetts, accounts for 31% of US GDP. The quintile of the most productive European regions accounts for 29% of Europe’s GDP.