Inequality: an analysis over time
While income inequality has declined sharply around the world over the past 30 years thanks to the rapid economic growth of emerging countries such as China and India, it has increased in developed countries such as the United States, Germany and even France.

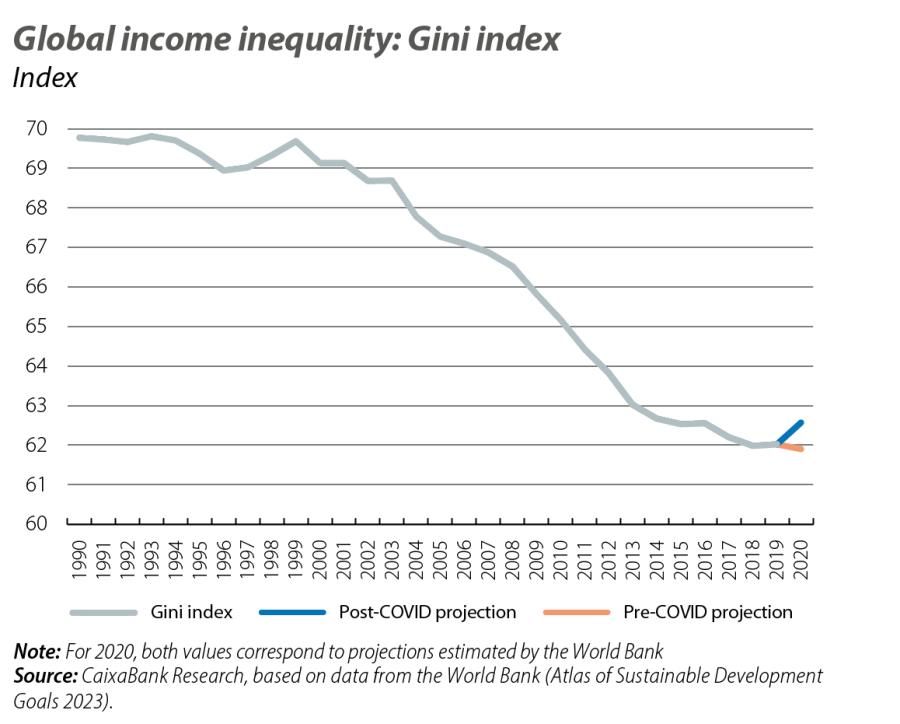
The analysis of global inequality over the last 30 years, contrary to the common perception of increasing inequalities, reveals a success story: the Gini index declined sharply and almost uninterruptedly between 1990 and 2019. This is due to the rapid economic growth of emerging countries such as China and India, which has lifted millions of people out of poverty and increased income convergence between countries. The COVID-19 pandemic only put a momentary brake on this improvement in global inequality (see first chart). According to the World Bank, the Gini index rose by 0.7 points compared to a scenario without the pandemic, a setback which unravelled the gains of the previous three years. While some countries succeeded in implementing effective measures to mitigate the impact of the pandemic, others, particularly the poorest economies, saw poverty and inequality increase.
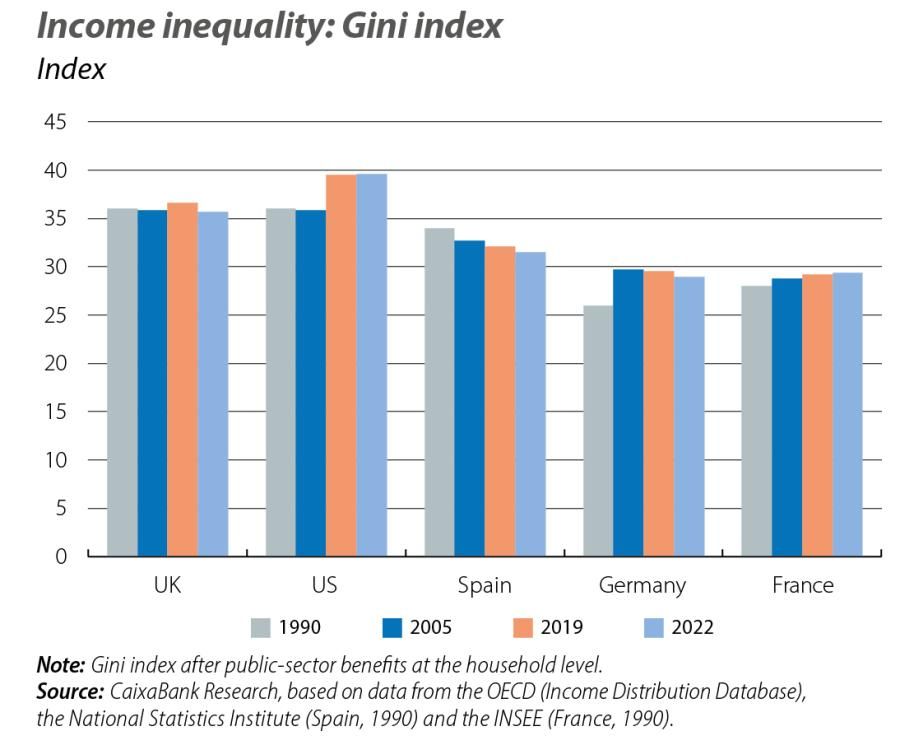
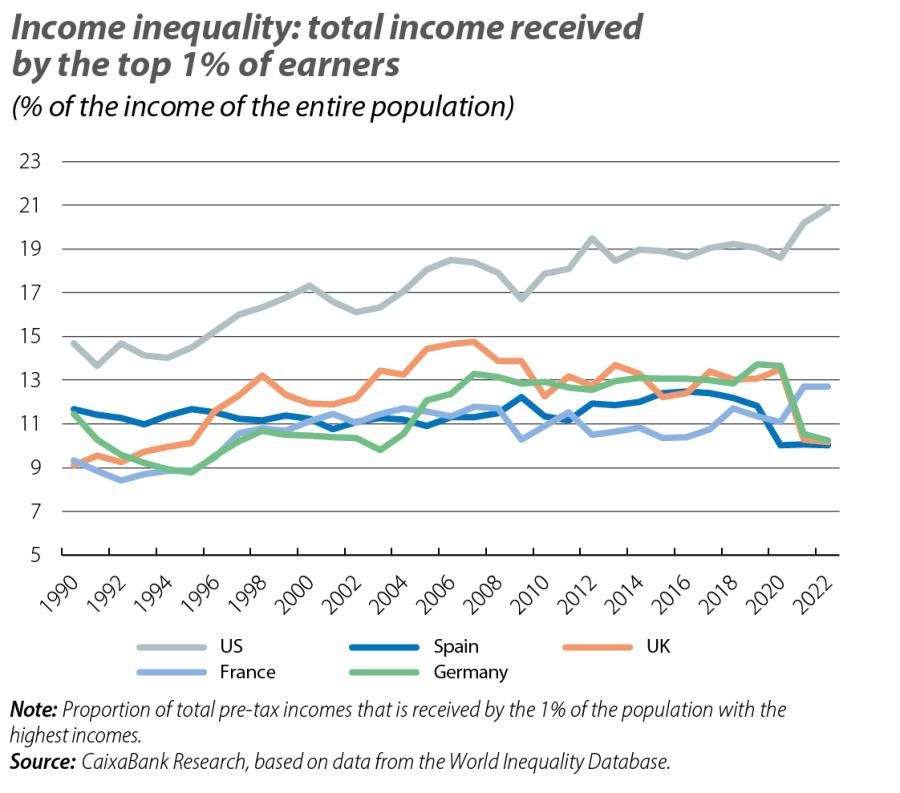
However, the analysis of inequality within countries, particularly in the case of developed economies, reveals a very different picture. Income inequality measured by the Gini index has increased over the past three decades in countries such as the US, Germany and even France (see second chart).1 In the case of Spain, this has not been the case: inequality in 2022 was lower than it was three decades ago, although it has suffered marked increases in times of crisis and remains higher than in France and Germany. A similar pattern emerges from alternative measures that focus on the extremes of the income distribution. The percentage of total income that is received by the top 1% of earners increased in the US from 14.7% in 1990 to 20.9% in 2022, and in France it rose from 9.3% to 12.7% (see third chart). Once again, the situation in Spain has been different, as the percentage of total income received by the top 1% in 2022 stood at 10.0%, 1.7 pps lower than the level of 1990.
- 1. In the case of the United Kingdom, the Gini index has remained at similar levels over the last three decades, although there has been an increase in inequality at the extremes, which is better reflected by measures such as the percentage of total income that is received by the top 1% of earners.
It should be noted that during the COVID-19 pandemic, income inequality after government subsidies decreased in developed countries due to the massive income support programmes that were deployed (such as the ERTE furlough scheme in Spain). Without these public support measures, however, working households’ incomes would have fallen significantly.2
- 2. See S. Stantcheva (2022). «Inequalities in the times of a pandemic». Economic Policy, 37(109), 5-41.
Another important vector of economic inequalities is the uneven distribution of wealth. Wealth inequality, in part, results from the accumulation of income inequalities, although other factors, such as the receipt of inheritances or the types of assets in which wealth is invested, also have an impact.3 Changes in asset prices, such as those of housing and financial assets, affect households differently depending on where they lie in the wealth distribution. In general, people with higher incomes tend to have a larger proportion of their wealth invested in financial assets. Thus, households with lower levels of wealth tend to be more sensitive to changes in house prices, whereas wealthier households tend to be more affected by changes in the profitability of financial assets.
- 3. See ECB (2024). «Introducing the Distributional Wealth Accounts for euro area households», ECB Economic Bulletin, Issue 5/2024.
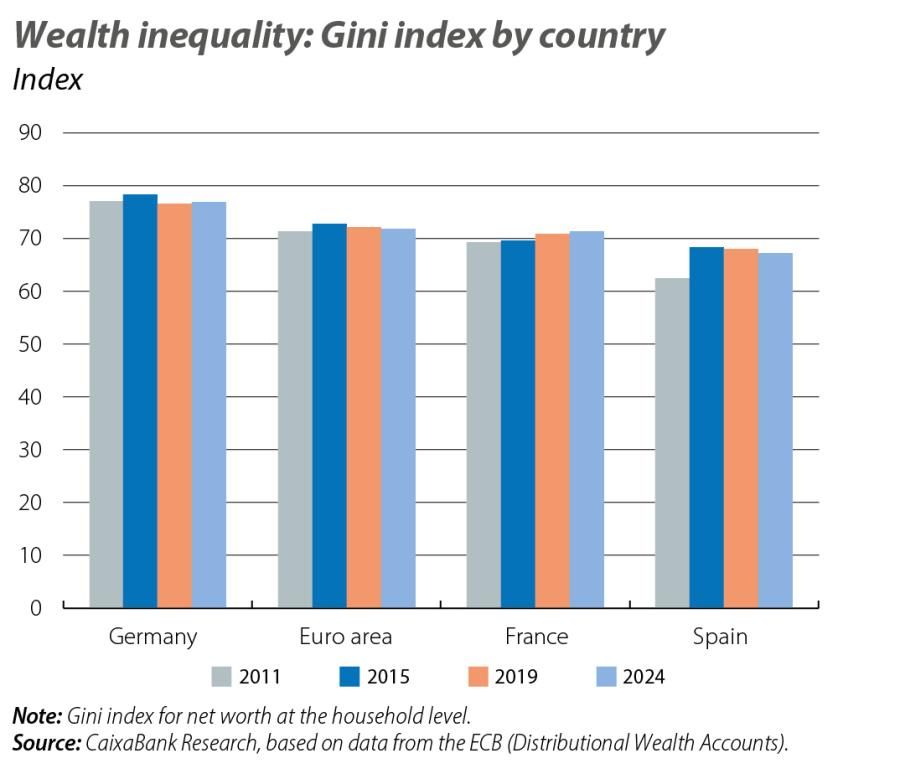
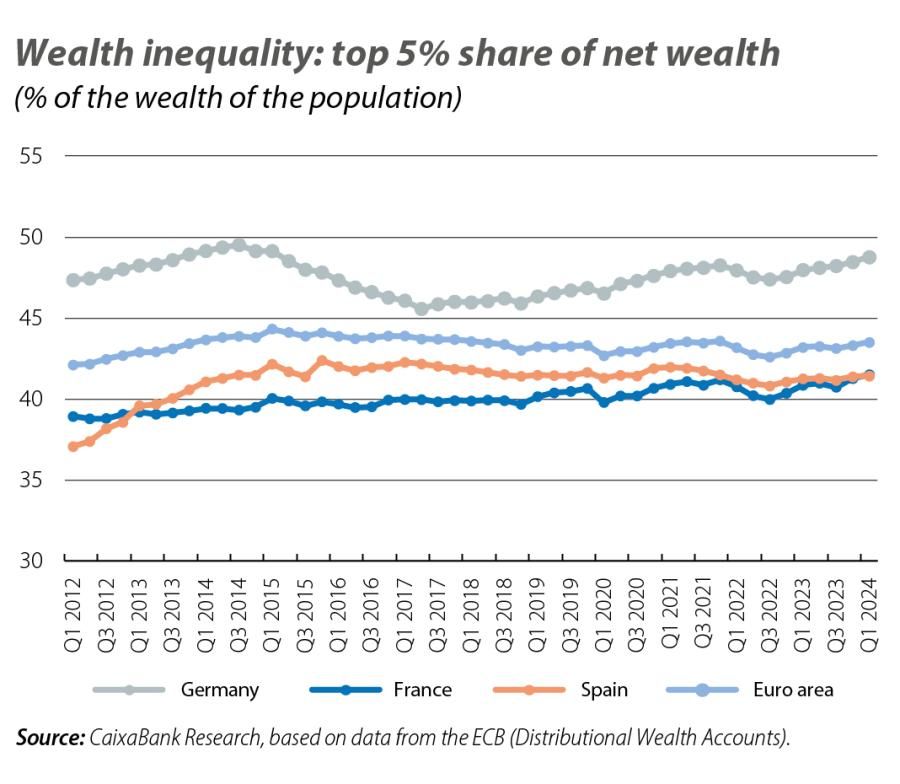
If we look at the evolution of wealth inequality, the situation is more uniform among the main euro area countries than it is for income inequality. Specifically, the Gini index increased after the financial crisis, but it has declined in most countries since 2015 (see fourth chart). In Spain, the Gini wealth index stood at 67.2 points in 2024, below the level of France (71.3 points) and Germany (76.9 points). Metrics that measure the percentage of wealth that is held by the wealthiest 5% of the population (and with a net worth of at least 1 million euros) also show increases in wealth inequality after the financial crisis in the euro area, and in particular in Spain, but greater stability from 2015 to 2024 (see fifth chart).
In summary, although income inequality has shown divergent trends globally and within developed countries, in most countries income inequality has increased in the last 30 years, with the notable exception of Spain. On the other hand, wealth inequality has followed a more uniform trajectory in the euro area, with sharp increases following the global financial crisis that have partially eased since 2015. Both variables are of crucial economic relevance for households and it is important to monitor their evolution and adapt public policies to the observed reality.
- 1. In the case of the United Kingdom, the Gini index has remained at similar levels over the last three decades, although there has been an increase in inequality at the extremes, which is better reflected by measures such as the percentage of total income that is received by the top 1% of earners.
- 2. See S. Stantcheva (2022). «Inequalities in the times of a pandemic». Economic Policy, 37(109), 5-41.
- 3. See ECB (2024). «Introducing the Distributional Wealth Accounts for euro area households», ECB Economic Bulletin, Issue 5/2024.


