Exposure of the European economy to a US tariff hike: a perspective through values chains
The impact on the EU of a universal tariff on US imports of goods goes beyond the direct effect it will have on exporting companies, as it will also be felt indirectly across the economy as a whole and throughout European and global value chains.
To capture this greater complexity, as a starting point we use the international input-output tables produced by the OECD,1 which reflect the transactions of intermediate and final products for 45 sectors in 77 different economies. We restrict these transactions to US imports of goods2 from the rest of the world, which is the category of imports that would be subject to the universal tariff, and although the latest available year is 2020, we use the data for 2019 in order to avoid possible distortions resulting from the COVID-19 pandemic.
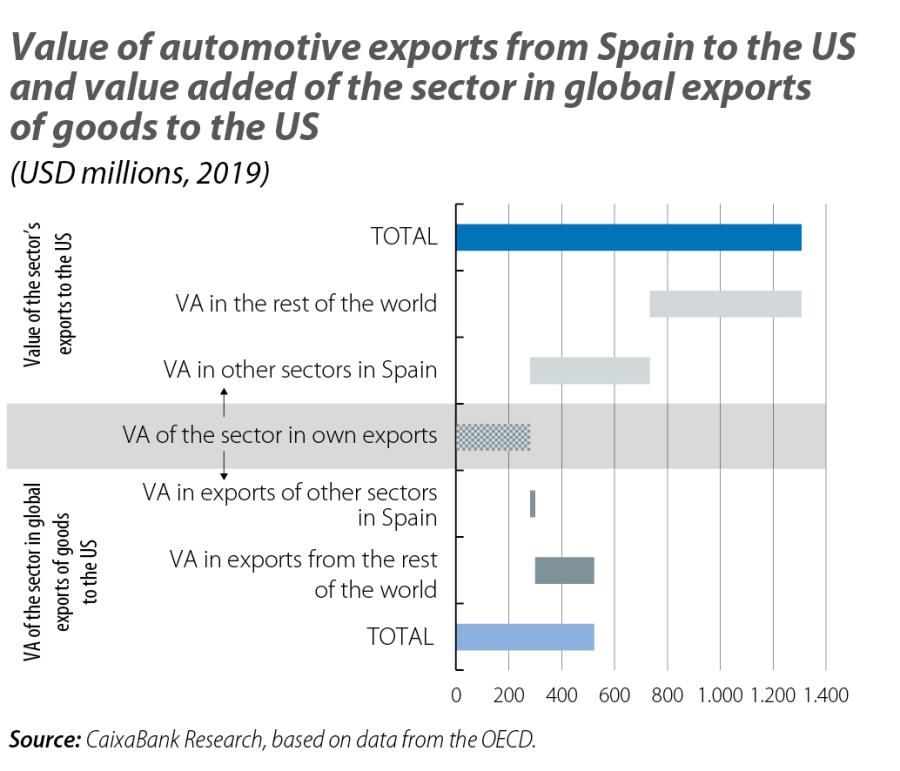
In the first chart, we analyse an example to illustrate how the figure for gross exports to the US of a given sector in an EU country (the measure of immediate exposure) relates to the value added by the EU, which is linked to the set of all global exports of goods to the US (the ultimate exposure measure).
In 2019, Spain exported around 1.3 billion dollars in manufactured goods in the automotive sector to the US, of which approximately 20% correspond to value added in the sector itself, a third to value added in other sectors within Spain (intermediate goods and services) and just over 40% to value added in other countries (both other EU Member States and the rest of the world).
On the other hand, beyond its direct exports, manufacturing in the automotive sector also indirectly generates value added in other exports of goods to the US, both from other sectors of the Spanish economy and, above all, from other countries (slightly more than 200 million dollars, almost as much as in direct exports). In total, the ultimate exposure of manufactured goods in the automotive sector stood at around 500 million dollars in 2019, well below the immediate exposure.

The position in value chains and production specialisation as key factors
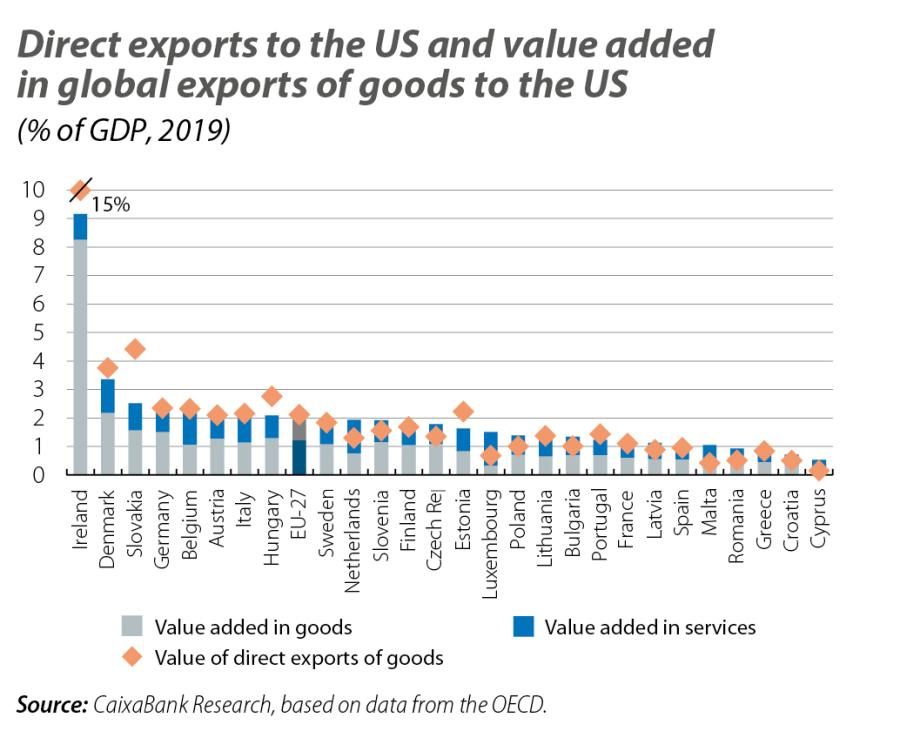
In the above example, the value added in the sector linked to global exports of goods to the US is lower than the value of direct exports, but in other cases it is equal or higher, as is the case for all service sectors, for example, as these only reflect the indirect effects via the export of goods. The outcome for an economy as a whole will depend on the relative weight of the various factors, as well as on its sectoral structure. The aggregate differences for the EU as a whole and for each of the 27 Member States can be seen in the second chart.

Of particular note are countries such as Ireland – which clearly remains the economy most exposed to exports to the US – and Slovakia, Hungary and Estonia, all of which have a significant manufacturing sector specialising in the downstream phase of value chains and with the presence of multinationals. In these countries, gross exports tend to overestimate the economy’s dependence on trade with the US when compared to the value actually added in the territory.
The opposite is true in countries such as Cyprus, Malta, Luxembourg and the Netherlands, which are geared towards service activities in the upstream segment of value chains and have a mostly indirect sensitivity to changes in tariffs on the goods in which they add value. To a lesser extent, and with a greater role of manufactured goods, Romania, Croatia, Poland, the Czech Republic and Bulgaria also show a degree of upstream specialisation in value chains that lead to the export of goods from third countries to the US.
Among the major economies, as is the case for the EU as a whole, the differences between the value of direct exports and the value added in all global exports of goods to the US are small, reflecting the diversification of their production base. Germany remains the most exposed country, with 2.5% of its GDP, followed by Italy (2.1%, in line with the EU aggregate). Some distance behind we find France (1.2%) and Spain (1.1%), both of which have a balanced contribution between value added in the goods and the services sectors.

Utilities, trade, transport, and professional and auxiliary services, among the hardest hit
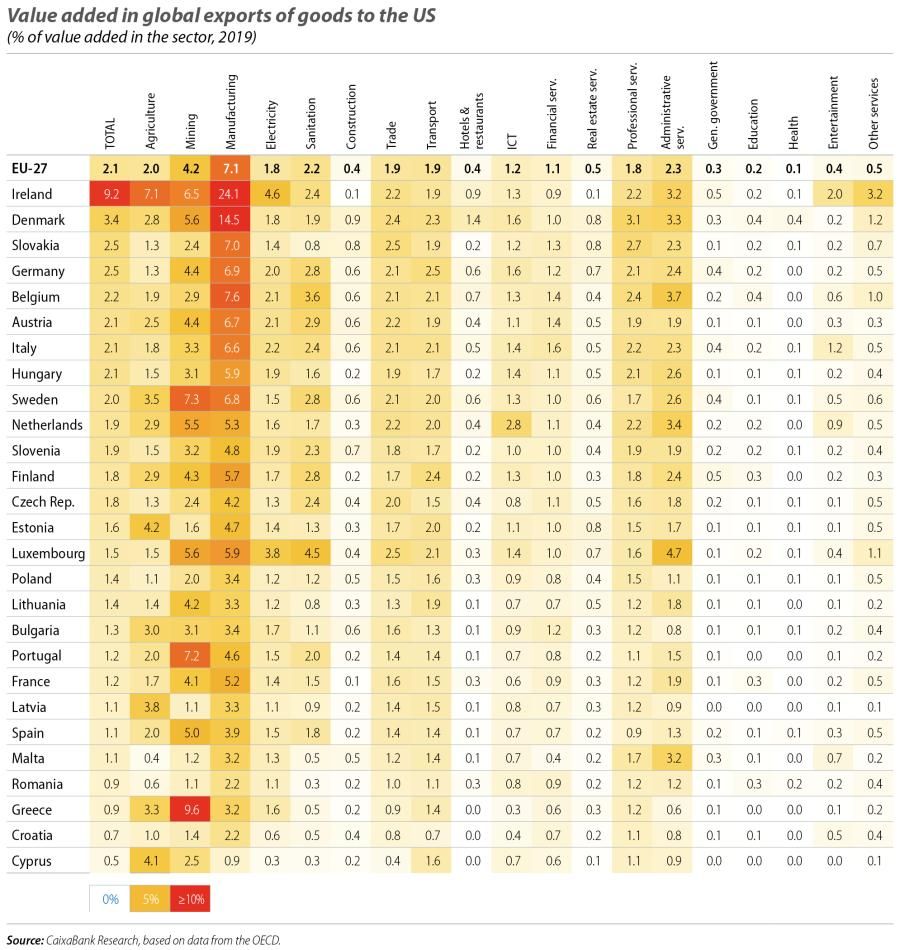
In more detail, for the EU as a whole and for each Member State, the table shows the percentage of sectoral value added that is linked to global exports of goods to the US.
Logically, the goods sectors show the highest percentage of dependence. In the case of agriculture, the figure stands at 2% for the EU as a whole, with high values in the case of Ireland, and it would be the sector hardest hit in relative terms in Latvia and Cyprus. Mining shows a slightly higher percentage of 4% in aggregate, with particularly high figures in Greece, Sweden and Portugal, where it is the most exposed sector.
Manufacturing is clearly the sector with the highest percentage of value added linked to US imports, at 7% for the EU as a whole, almost 25% in the case of Ireland and around 15% for Denmark. Among the main economies, the manufacturing sector in Germany and Italy has a similar percentage to the aggregate, above France’s 5% or Spain’s 4%.
In services, however, there are a good number of sectors that show a similar degree of exposure to that of the economy as a whole, around 2%. These include not only the services that are more traditionally linked to the export of goods, such as transport and trade – which are of similar importance in all Member States – but also others such as the supply of electricity, gas and water sanitation (utilities), as well as professional and scientific services – with high percentages in Denmark and Slovakia – and administrative and auxiliary services – with high values in the Benelux countries. Among other branches of services, information and communication technologies plays a particularly important role in the Netherlands, with a share of around 3%, compared to just over 1% in the EU as a whole.
Recent trends in US imports suggest a slight increase in exposure in the EU
The major disadvantage of using the value chain approach is the delay with which input-output tables are published, both nationally and internationally. To try to address this problem, we have made an estimate for 2023 based on data on US bilateral trade with the rest of the world, disaggregated by product.3 Due to data limitations and in order to avoid risks over the reliability of this exercise, we maintain the so-called technical coefficient matrix (which inputs, and from where, are used in the production process) that existed in 2019.
For the EU as a whole, the share of value added in the US’ global imports of goods would increase by 0.2 points to 2.3%, which is consistent with the growth of this market as a destination for European exports.4 By Member State, the increase in Slovenia stands out, which could be linked to the country’s increased participation in the value chains of pharmaceutical products that Switzerland exports to the US. The main economies, for their part, show an even increase of 0.2 pps, placing the figure for Spain at 1.3% of GDP. Conversely, there is a significant decrease in the Member States that have the highest dependence percentages, namely Ireland and Denmark, with the latter now being slightly surpassed by Slovakia.
We thus see a trend in recent years towards greater exposure of the European economy to a universal tariff on US imports. Overall, this exposure still remains moderate, but there are particular sectors and countries which need to be considered when assessing its effects and the possible responses on the part of the EU. Among these particular cases, we should recall the complexity of value chains and the fundamental role that service activities play as providers of inputs that are essential to manufacturing processes.


