
How is Portugal’s household wealth distributed?
The wealth of Portuguese households has increased in recent years and the distribution by level of wealth or employment status shows little difference with respect to the euro area. However, the proportion of liabilities that are borne by the less wealthy half of the population is relatively higher.
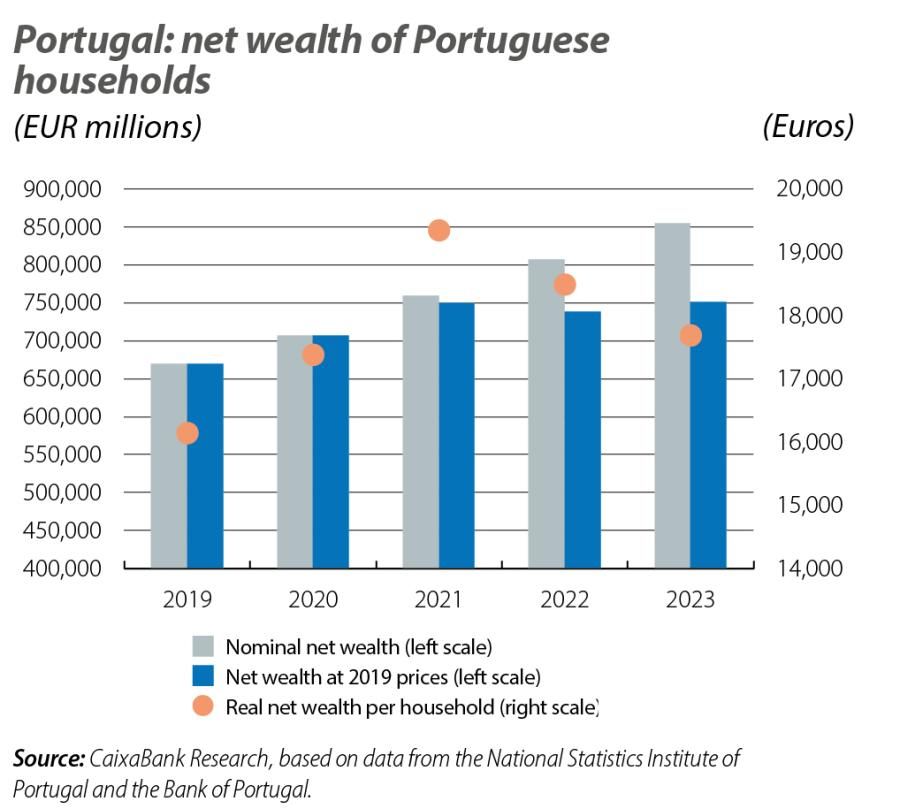
n 2023, the net wealth of Portuguese households reached 855 billion euros, representing an increase of 6% compared to 2022 and of around 28% compared to 2019. A less pronounced movement occurred in real net wealth, which, at 2019 prices, rose 1.6% year-on-year and stood 12% above the 2019 level. Real net wealth per household, for its part, has also registered positive growth, and at the end of 2023 it stood 9.6% above the figure for 2019.
The appreciation of the housing market has been the main driver of the increase in nominal wealth, given that since the end of 2019 home prices have grown by 45%. Another factor that has influenced the increase in net wealth has been the fall in financial liabilities.
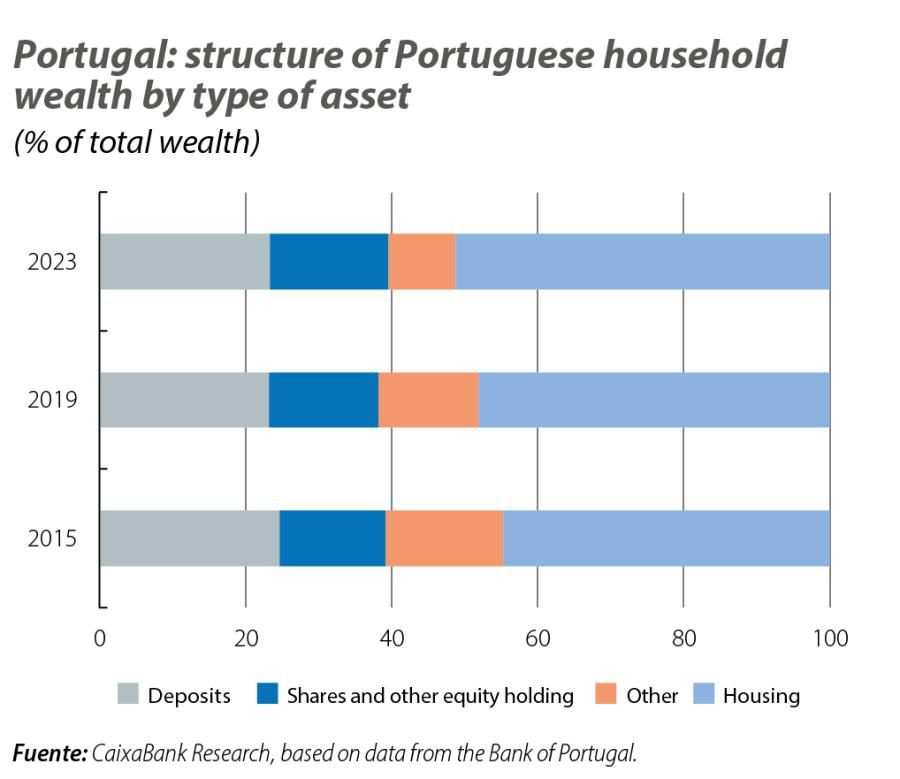
Housing is the main destination of Portuguese household wealth; not only does it account for 51% of total wealth, but the portion it represents of the total has increased by around 3 pps since 2019. Looking at the breakdown of financial wealth, deposits stand out, representing 48% of financial assets and 23% of total net worth.
Assets by level of household wealth
In early 2024, the ECB began publishing statistics on household wealth, which allowed for a more detailed analysis of the data, in particular with the classification of households by wealth percentile and according to their situation in the labour market.
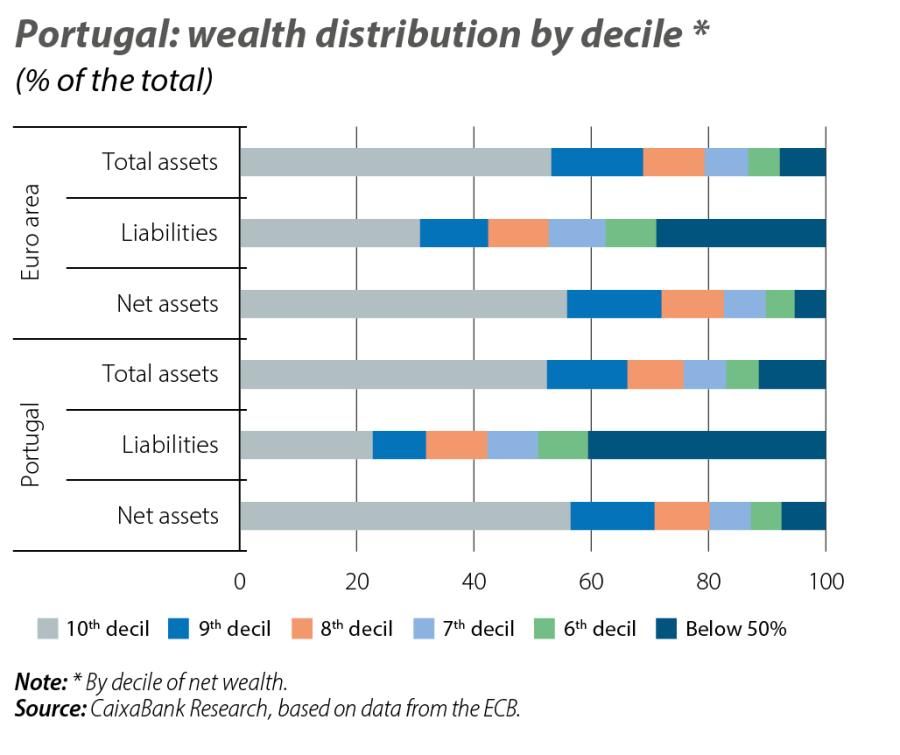
With data from 2023, we can observe that the concentration of wealth within the top 10% of the population in terms of net wealth in Portugal is similar to that of the euro area: more than half of all assets are concentrated in this 10% of the population. Among the lower 50% of the population in terms of wealth, the percentage of assets held is higher in Portugal than in the euro area and no significant changes have been observed since 2019. It should be mentioned that in 2023 total assets decreased by 1.5% compared to 2022, but they are still 15.4% above the 2019 level, mainly due to the almost 13% appreciation recorded by real estate assets.
However, liabilities are concentrated in the population with the lowest net wealth: 40% of all loans for home purchases are concentrated in this segment, as is 42% of other forms of credit, primarily consumer credit. It is also in the lower segment of wealth that there was an increase in liabilities compared to 2022: more than 945 million euros, of which 649 million were for the purchase of homes.
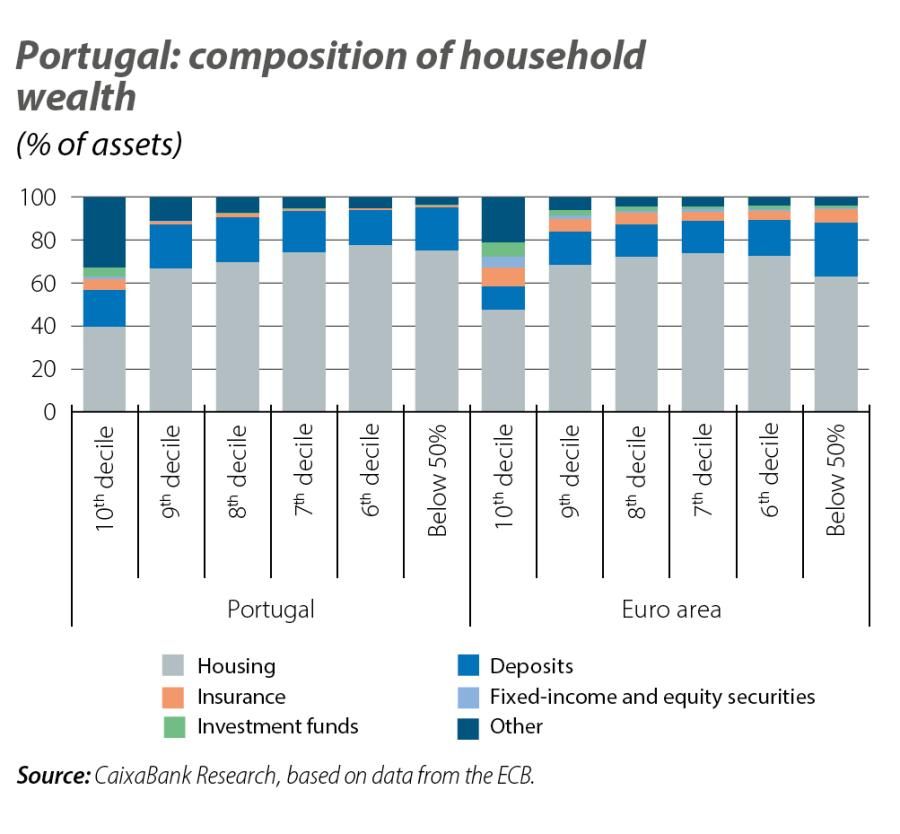
Among Portuguese households with the lowest net wealth, the portion of their wealth that corresponds to housing is substantially greater than in the euro area as a whole, at 75% versus 63%. This also explains why liabilities are higher in this group of the population. In turn, financial assets, especially deposits, account for just 21% of the assets of the lower 50% of Portuguese households, contrasting with the euro area average of 33%. The other components of wealth, which are similar in Portugal and the euro area, correspond to financial and non-financial assets associated with commercial activities or freelance professions.
Household wealth according to employment status
The data on household wealth, taking into account people’s situation in the labour market, show that the distribution of assets and liabilities is similar in Portugal and in the euro area for those in employment. However, the share of wealth that is in the hands of the retired population is higher in the euro area than it is in Portugal: specifically, Portuguese retirees account for 23% of total assets, which is around 6 pps less than in the euro area as a whole. The opposite situation is observed among self-employed workers, who in Portugal hold 22% of all household assets, some 2 pps more than in the euro area.
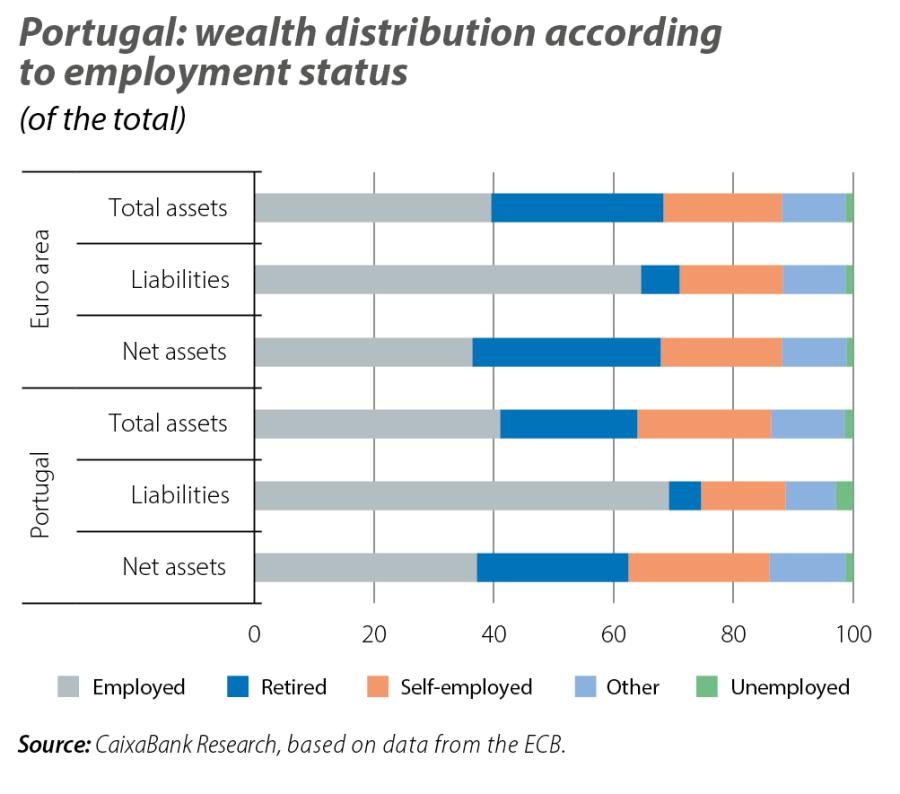
In terms of liabilities, these are mainly concentrated among those in employment: in Portugal, around 70% of total liabilities correspond to this group, and they are the ones with the greatest capacity to pay off debts. In addition, it is observed that the liabilities of the unemployed are quite low: just 2.8% of all liabilities are held by these people.
Conclusion
Portuguese households have increased their wealth in recent years and do not show any significant differences in its distribution by level of wealth or according to employment status with respect to the euro area. Only the proportion of liabilities that are borne by the less wealthy half of the population is relatively higher in Portugal. This no doubt reflects the effort required by this segment of the population in recent years in purchasing homes, as they tend to be younger and have not yet accumulated significant assets.