The deleveraging of Portuguese companies
We analyse the improvement in Portuguese companies’ financial position due to their reduced levels of debt.

We have previously addressed the debt situation of Portuguese non-financial corporations (NFCs), analysing aspects such as the reduction of the volume of NFC debt relative to GDP and its convergence with euro area levels, the reduction of the proportion of debt that is owed to national credit institutions and the types of debt taken on. In this article we focus on looking at how this lower indebtedness among Portuguese companies on aggregate has been reflected in a strengthening of their financial statements.
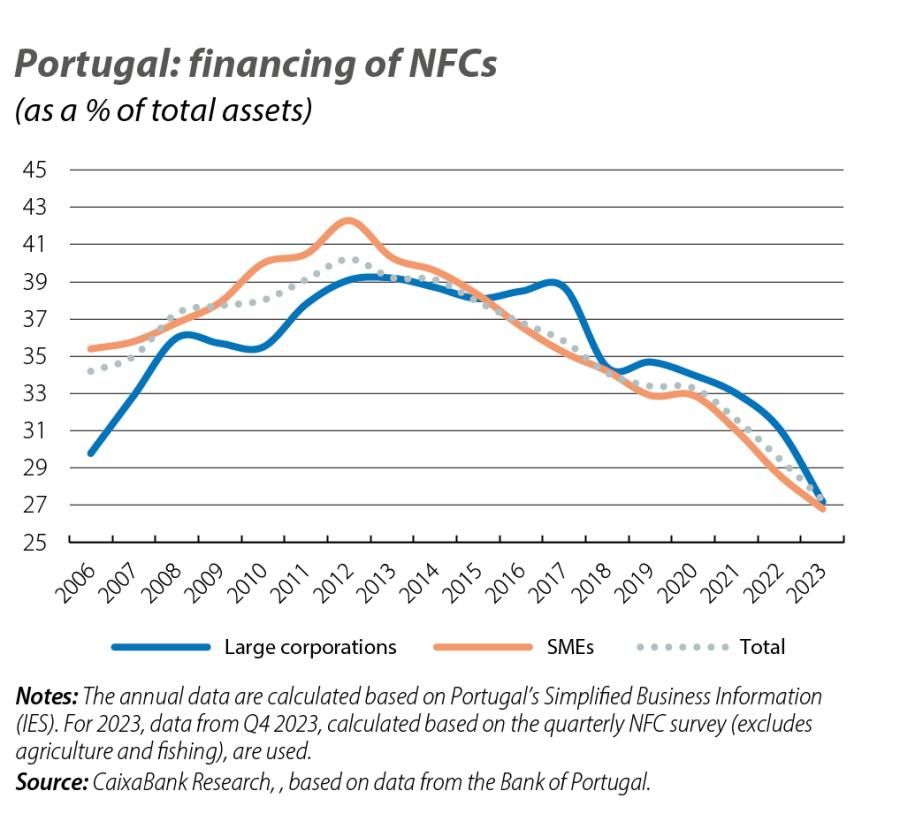
Firstly, we consider the financing obtained as a percentage of companies’ total assets – a ratio which indicates the proportion of assets that have been financed with debt at a cost. The lower this ratio is, the less debt lies behind a company’s assets, which translates into greater solvency. As shown in the first chart, this ratio reached its peak in 2013 in large corporations and in 2012 in the case of SMEs, at 39.2% and 42.3%, respectively. Since then there has been a downward trend, culminating in a ratio of 27.3% for NFCs as a whole at the end of 2023.
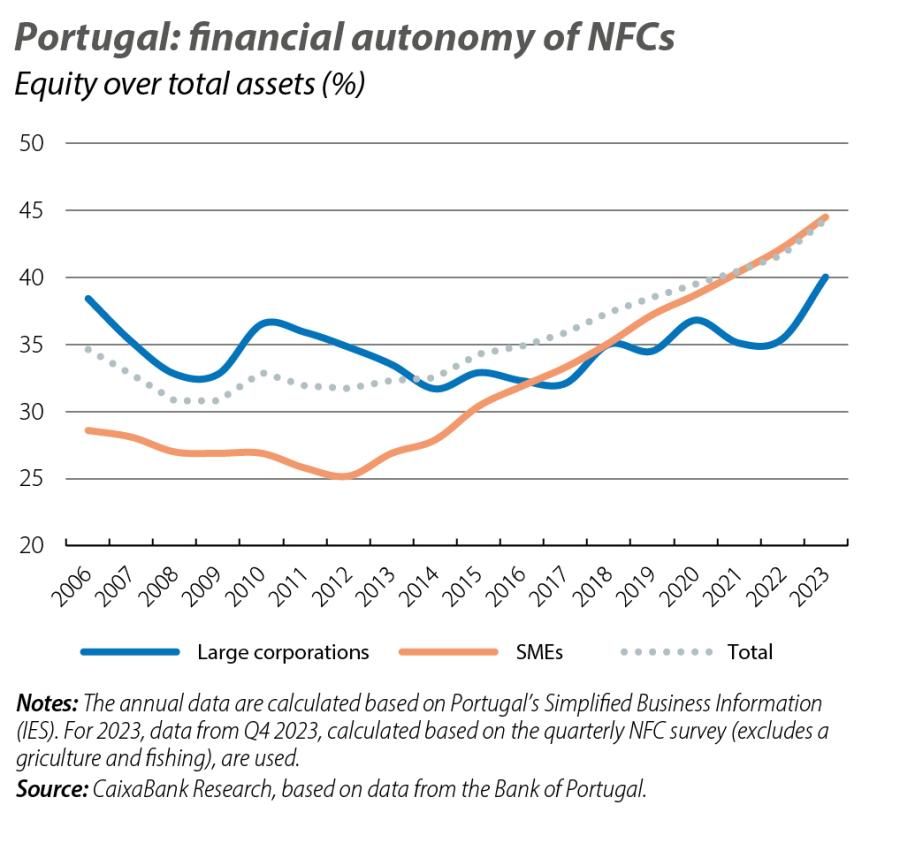
Another metric of financial health is financial autonomy, which measures a company’s total shareholders’ equity relative to its total assets and reveals to what extent the assets are supported by the company’s own capital, i.e. by what percentage the capital finances the assets. The trend in this ratio is also one of improvement: for all companies on average, the ratio has increased from 34.6% in 2006 to 44.3% in 2023; in the case of SMEs specifically, the trend has been similar. In the case of large corporations, despite having ended 2023 with a financial autonomy of 40%, the trend has been more oscillating; one of the reasons for this volatility may be related to large corporations’ greater capacity to optimise their financial structure according to the business and monetary cycle. For instance, in periods of lower interest rates it may make sense to make greater use of debt rather than equity capital, as shareholders demand a higher return on their capital than the cost of debt.
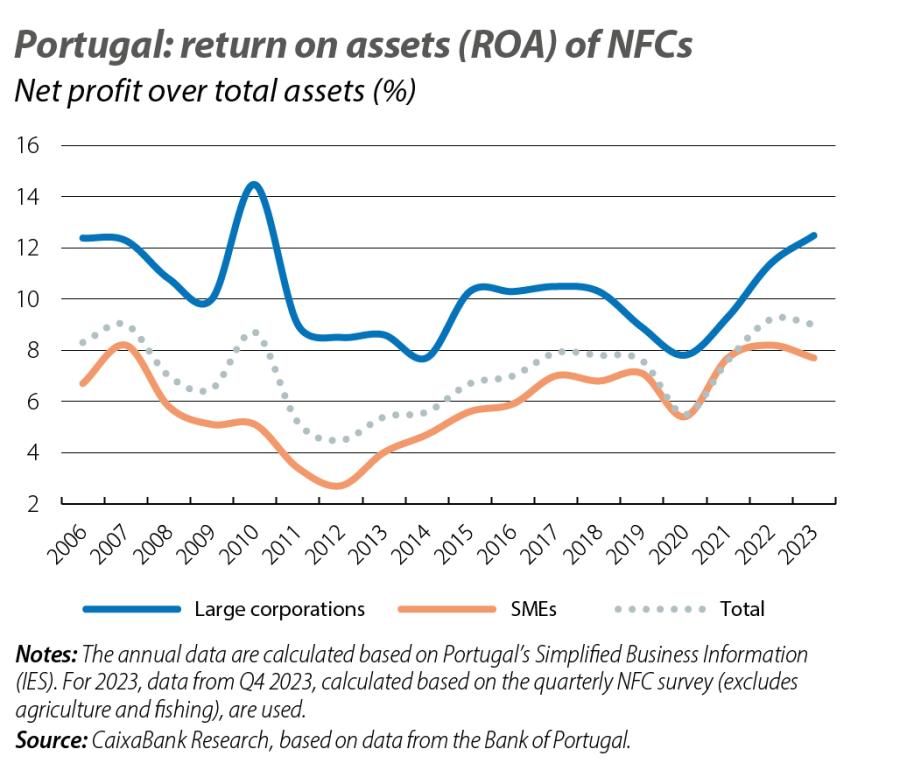
In terms of profitability, the trend is not so clear. The third chart shows the return on asset (ROA), i.e. net profit as a percentage of total assets. For all companies as a whole, this ratio has been improving since 2012, albeit with a drop in the year in which the pandemic broke out. The ROA is also significantly higher in large corporations, as we would expect given that these companies are more productive and produce higher value added.
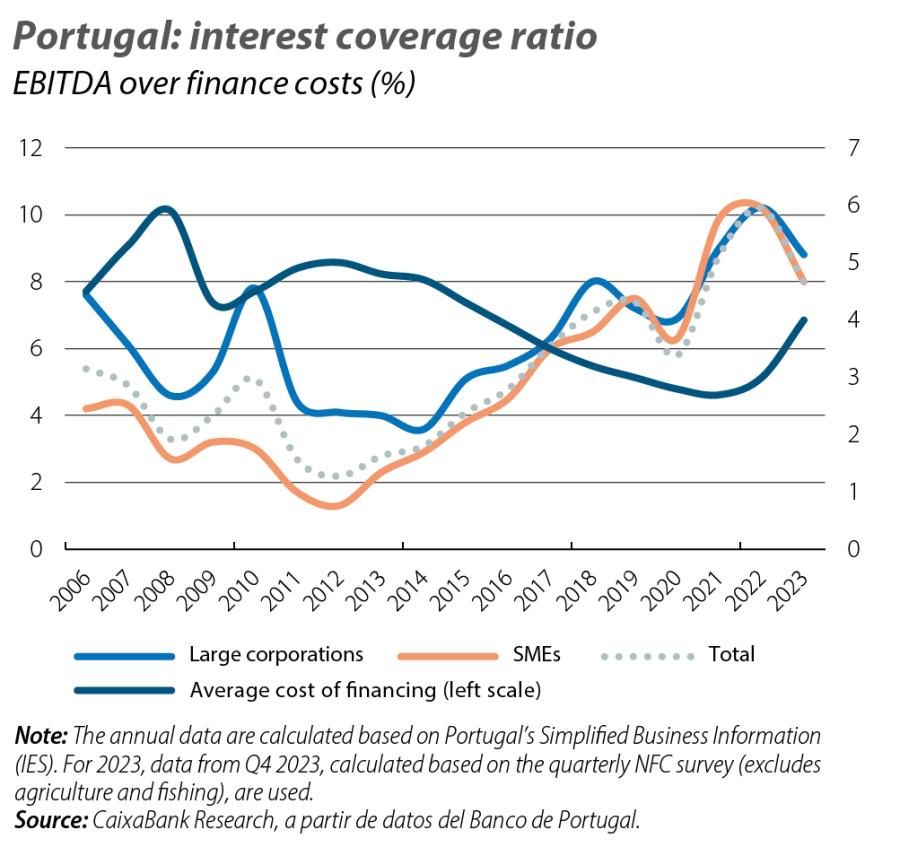
We also analysed indicators related to a company’s capacity to meet its commitments arising from financing. The fourth chart shows the interest coverage ratio, which measures how many times a company’s EBITDA exceeds its finance costs. A higher ratio means that the operating profits generated by the company cover its financial burden with greater headroom, which translates into less financial pressure. A ratio below 1 would mean that the profits generated would be insufficient to cover the commitments due to interest charges and other financial burdens. Fortunately, Portuguese NFCs have an interest coverage ratio of eight, meaning that their finance costs are covered eight times over by their EBITDA. This ratio has also followed a clear upward pattern since 2012, when it recorded a very poor value for NFCs as a whole (2.2). Despite this upward trend, in 2023 the ratio recorded a decrease, mainly due to the rise in financing costs associated with the interest rate hikes.
The table compiles these ratios for the main sectors and sizes of NFCs. In terms of financial autonomy, industry has the most favourable ratio (48.3%), although it should be noted that both the electricity, gas and water sector, and the services and trade sector have ratios in excess of 40%. In this parameter, the transportation and storage sector shows the weakest ratios, although it has recovery by 12.8 pps from the low point recorded at the end of 2012. In this vein, transport is also the sector in which debt with a cost finances the highest proportion of assets. In terms of financial pressure, the construction sector faces the greatest burden, although it has improved significantly since 2011-2012, when its EBITDA did not cover its financing costs. Since 2014, the sector has gained momentum with an increase in business creation and a rise in the value of residential properties. The cycle of uninterrupted price increases in residential properties since 2014, as well as certain major public works on the horizon, explain the trajectory of improvement in the ratios and suggest that some good years of economic and financial recovery lie ahead for companies in the sector.
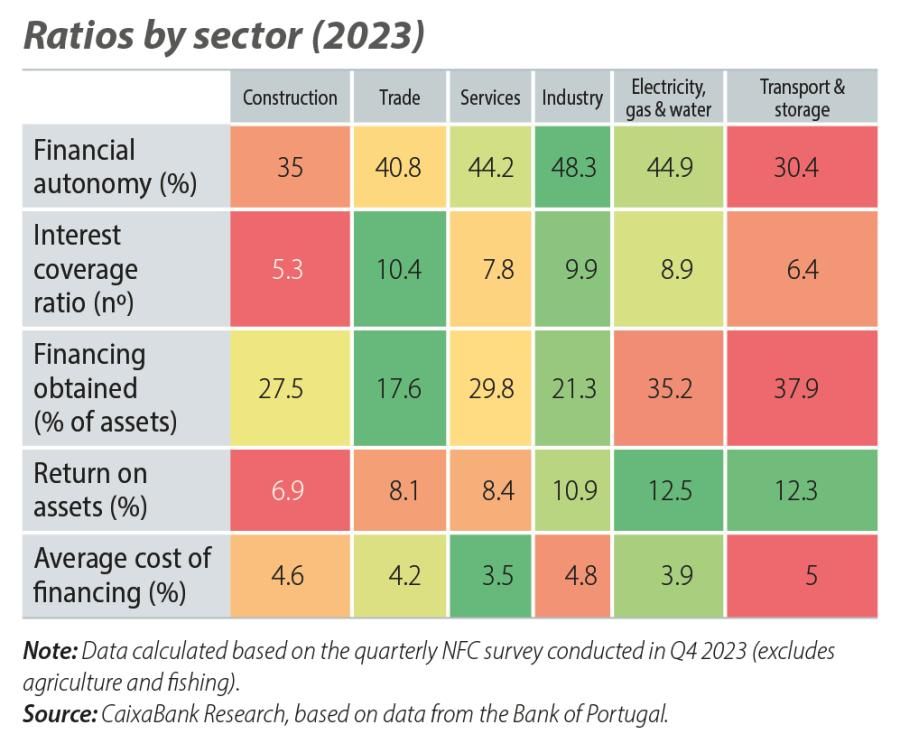
Finally, the average cost of financing is the parameter with the narrowest range between the sectors with the highest and lowest levels (transportation and storage and services, respectively, with 5% and 3.5%). This is due to the fact that variable-rate financing, indexed to the Euribor, predominates in all sectors. The higher risk premium for the transportation and storage sector is due to the fact that it is the most highly leveraged sector and possibly due to it having a greater proportion of smaller companies.