The Beveridge curve and the mismatching of professional skills in the euro area
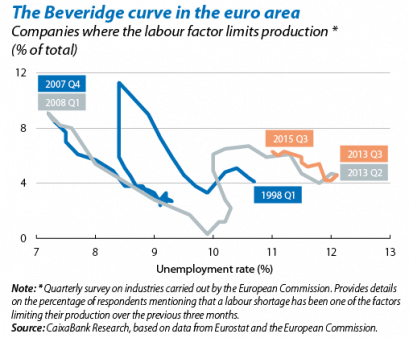
The Beveridge curve shows the relationship between the unemployment and the job vacancy rates. Movements throughout the curve, when job vacancies and unemployment move in opposite directions, show the impact of cyclical fluctuations in economic activity on these variables. An expansionary phase is therefore characterised by low unemployment and a high job vacancy rate while a recessionary phase is the opposite situation. On the other hand outward movement by the whole curve; i.e. when there is a higher unemployment rate for the same job vacancy rate, points to a possible deterioration in the matching process. This phenomenon, when it is much more difficult to fill a vacancy and therefore a lot of companies believe a labour shortage is limiting their production, is associated with a larger mismatch between the skills required by firms and those available in the labour force.1
The Beveridge curve for the euro area moved outwards during the crisis (see the first graph) and, except for Germany, all countries saw a deterioration in the matching of the labour market to a greater or lesser extent. It is significant that the influence of the improved economic cycle can already be seen on the curve although there has not been, for the moment, any shift inwards or, in other words, more efficient matching.
One way of assessing the effect of skills mismatch on the matching process is provided by the skills mismatch index (SMI) which compares the level of education of the working age population (which would represent the labour supply) with those in employment (similar to the demand).2 This index increases as the gap between the qualifications of these two groups widens, something which occurred in the euro area during the recession when the SMI tripled. Spain was mainly responsible for this growth (see the second graph), which comes as no surprise given the nature of its crisis, closely linked to real estate whose labour force is typically less highly qualified. The case of Ireland is similar because it also experienced a shock in the construction industry, albeit less severe. This index appears to be improving in both countries as the economic environment recovers but it is falling very slowly since a large part of the rise in the SMI was due not only to cyclical factors but also to structural.
In the rest of the countries the crisis was concentrated less in one specific sector so the trend in their SMI should be less dependent on the economic cycle. In fact, the increase observed in France, for example, is gradual, suggesting that the mismatch in the French labour market is gradually increasing and is structural in nature. Once again the notable exception was the German SMI, following a downward trend and helping its labour market to perform well. Lastly other economies such as the Netherlands have a very low level of skills mismatch, something which undoubtedly makes their matching process much more efficient.
To sum up, in most euro area countries the increase in skills mismatch is making the labour market's matching process more difficult. Although part of this change has been cyclical and will therefore reverse with the economic recovery, another significant portion is structural. Hence the need for greater coordination between passive and active policies and to promote training programmes that help to match the human capital of the unemployed with companies' needs.
1. Changes in how labour market institutions operate can also move the Beveridge curve.


