Why do similar assets have differing yields?
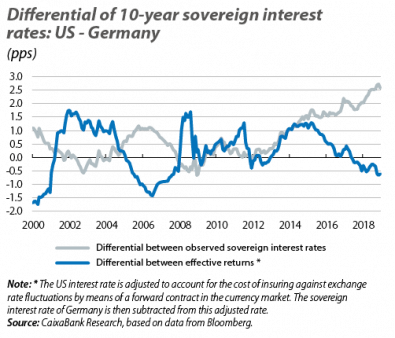
• The difference between the effective returns of investing in bonds from different regions is less than that suggested by the interest rate differentials observed in the markets (such as the 260-bp difference between US and German 10-year sovereign bonds).
• A portion of these differentials reflects the cost of insuring against exchange rate fluctuations. When this is taken into account, we see that recently the return that a European investor obtains from investing in US sovereign bonds ends up being lower than that of investing in their German equivalents.
• Divergence in monetary policy generates interest rate differentials, and limits on arbitrage due to regulatory changes prevent them from disappearing.
In recent years, a significant gap has opened up between interest rates in advanced economies. For example, in 2018, the yield on the 10-year US sovereign bond stood at around 2.9% on average, while the yield on the German, Japanese and British equivalents registered an average of 0.5%, 0.1% and 1.4%, respectively. Given that these bonds are highly interchangeable and are traded in highly-globalised financial markets, how can there be such high interest rate differentials?
The role of exchange rates
The exchange rate is the key intermediary factor between yields on assets denominated in different currencies. For example, to buy a European bond with a yield of i€ , a US investor must first buy euros. In addition, when they wish to repatriate their investment in the future, they will have to go back to the currency market to convert euros into dollars. Therefore, if the exchange rate is S0 euros per dollar at the time of the investment and S1 at the time of repatriation, the return (in dollars) of investing 1 US dollar in this European bond will be:
\(\frac{(1+i_\unicode{0x20AC})S_0}{S_1}\)
In order for the investor to be indifferent to making this investment or buying a US bond with a yield of i$, the following would need to hold:
\(1+i_\$=\frac{(1+i_\unicode{0x20AC})S_0}{S_1}\)
Numerous studies show that this relationship, known as uncovered interest parity, is not supported by the data.1 One reason for this is that, unlike domestic investment, foreign investment involves assuming an exchange rate risk, given that it is not possible to know S1 in advance. Nevertheless, instead of repatriating the investment at the exchange rate prevailing when the bond reaches maturity (S1), at the outset the investor can contract an exchange rate of F0,1 euros per dollar at which to repatriate her investment in the future (known as the forward exchange rate). By using this instrument, the exchange rate risk is removed and investors would be expected to eliminate arbitrage opportunities, so that:
\(1+i_\$=\frac{(1+i_\unicode{0x20AC})S_0}{F_{0,1}}\)
This relationship, known as covered interest parity (CIP), is one of the pillars of economic theory, to the point that some consider it to be the closest thing to a law of physics in the field of international finance.2
The breakdown of CIP
To check whether CIP occurs in reality, we calculated a term known as cross-currency «basis», using the following formula (we will know that CIP holds if basis = 0):
\(1+i_\$=\frac{(1+i_\unicode{0x20AC}+basis)S_0}{F_{0,1}}\)
This term is shown in the first chart, for the purposes of comparing an investment at LIBOR interest rates denominated in dollars with investments at LIBOR interest rates denominated in euros, pounds and yen, from the point of view of a US investor. Before the global financial crisis of 2007-2008, the basis was practically nil, such that once the currency risk was neutralised, the LIBOR interest rates of the major advanced economies were reasonably equalised (i.e. CIP held).
However, the chart also shows that, since then, there have been systematic deviations from CIP and the basis has been negative most of the time. In other words, from the point of view of a US investor, it is now more attractive to make investments abroad (neutralising exchange rate fluctuations) than at the domestic level.
What is behind this breakdown of CIP? At the peak of the financial crisis, the deviations could be attributed to problems relating to the functioning of the global interbank markets: factors such as greater concern for counterparty risk3 and more limited access to wholesale markets in dollars restricted the ability to arbitrate between markets. However, widespread deviations have persisted after the restoration of the proper functioning of the markets, and they even intensified between 2014 and 2016. The available evidence suggests that this surprising persistence is due to two major factors:4
• Regulatory changes that reduce the capacity to take risks and take advantage of arbitrage opportunities.
• The divergence of monetary policies.
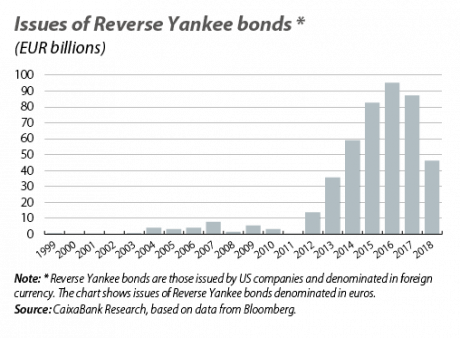
Firstly, in response to excessive risk-taking prior to the financial crisis, regulatory authorities have become stricter and have introduced measures that increase the cost of taking risks,5 thereby also restricting the ability to take advantage of arbitrage opportunities. Secondly, the divergence of monetary policies between the Fed and other central banks, such as the ECB, encourages investment in jurisdictions with higher interest rates (such as the US) and the issuing of debt denominated in currencies of regions with lower rates. As an example, as shown in the second chart, between 2012 and 2017, there was a significant rise in US companies issuing debt denominated in euros.6 As such, both elements represent an increase in the demand for dollars. Due to the limits on arbitrage, the premium in favour of those offering dollars that is generated by the increase in demand does not go away: that is, a negative basis occurs.7
Recent dynamics in sovereign interest rates
So far, our analysis has focused on LIBOR rates. However, in light of the importance of exchange rate risk and cross-currency basis, the question arises as to whether they can help us to explain the sovereign interest rate differentials discussed above. In fact, they do, at least in recent years. Specifically, although the difference between the 10-year sovereign interest rates of the US and Germany was practically +260 bps in December 2018, this difference falls to –60 bps when we adjust the US rate to account for the cost of covering the exchange rate risk that a European investor has to assume: in other words, the cost of covering the exchange rate risk explains the entire differential (and even more).
This can be seen in the third chart, which shows the differential between US and German sovereign interest rates, together with the difference between the effective return (from a European investor’s point of view) of investing in US sovereign bonds and in German sovereign bonds. Specifically, this difference is:
\(\;\frac{(1+i_{US})S_0}{{F_{0,1}}_{}}-i_{Germany}-1\)
As the chart shows, the difference in effective returns has been declining since 2016 (in line with the correction in the cross-currency basis observed from then on).8 In fact, in December 2018, and from a European investor’s perspective, the US 10-year sovereign interest rate, neutralised for the exchange rate risk, was approximately –0.35% (2.83% without neutralising it), compared to a German sovereign rate of +0.25%.9
In short, the differentials observed between interest rates are lower than they first appear. In part, they reflect the cost of insuring against exchange rate fluctuations, although the breakdown of CIP observed in recent years also suggests that arbitrage has lost strength as a force for equalising interest rates.
1. See, for example, K.A. Froot and R.H. Thaler (1990). «Anomalies: foreign exchange». Journal of economic perspectives, 4(3), 179-192.
2. See C.E. Borio, R.N. McCauley, P. McGuire and V. Sushko (2016). «Covered interest parity lost: understanding the cross-currency basis». BIS Quarterly Review.
3. The risk that one of the parties involved will not meet their payment obligations.
4. See footnote 2 and W. Du, A. Tepper and A. Verdelhan (2018). «Deviations from covered interest rate parity». The Journal of Finance, 73(3), 915-957.
5. For instance, with stricter capital requirements and leverage ratios, or limits on balance sheet exposure to foreign exchange risk.
6. These issues allow the issuer to obtain liquidity in euros, which US companies then convert into dollars with an exchange rate swap in order to avoid currency mismatches on their balance sheets.
7. The premium is generated in exchange rate swaps, a product with which two parties agree to exchange two currencies in the present at an exchange rate S, and also to reverse the exchange at a future date at an exchange rate F. A negative cross-currency basis indicates that, in such contracts, those offering dollars obtain a positive premium: i.e. after lending dollars at an exchange rate of S euros per dollar, they will be repaid in the future at an exchange rate F that offers fewer euros per dollar than CIP would suggest.
8. There is no clear explanation for the factors behind the correction in cross-currency basis since 2016. For a hypothesis based on the Base Erosion and Anti-Abuse Tax of the Trump Administration, see the article «Cross-currency basis feels the BEAT» at www.ftalphaville.ft.com.
9. Since the forward exchange rate (1.17 $/€ on average in December) offered more dollars per euro than the spot exchange rate (1.14 $/€), neutralisation leads to an appreciation of the euro that penalises repatriating a US investment to Europe.


