The factors driving Spanish household savings
The strength of the labour market and population growth due to migratory flows have led to a rise in Spaniards’ gross disposable income.
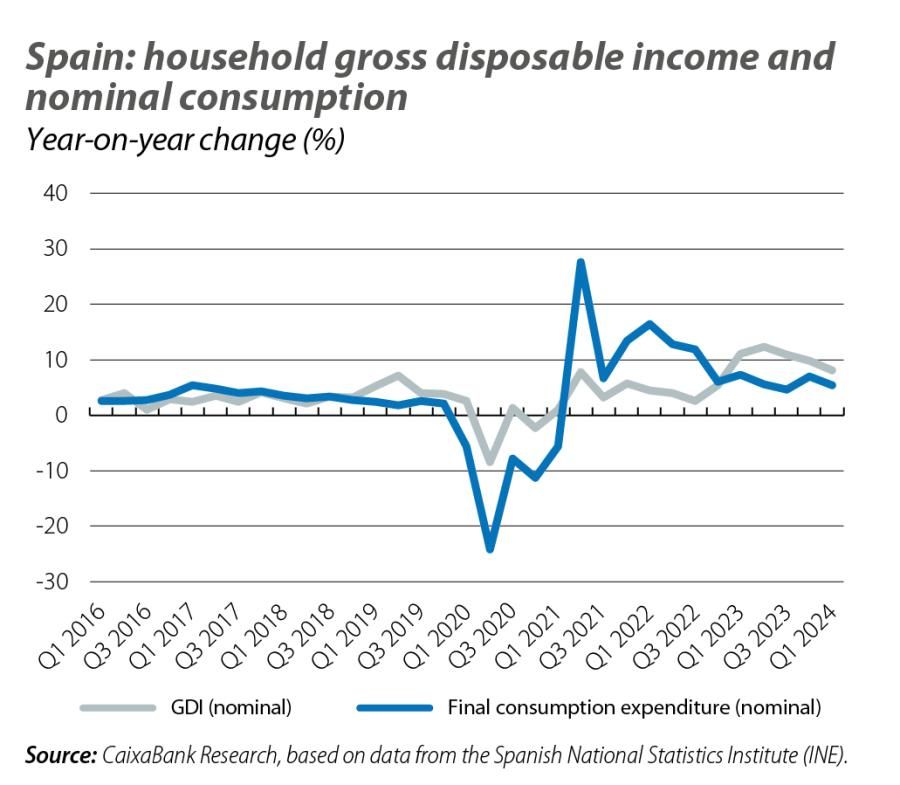
In 2023, the growth of households’ gross disposable income (GDI) in nominal terms was an impressive 11% year-on-year. On the other hand, household spending in nominal terms grew more timidly, rising by 6.1%. As
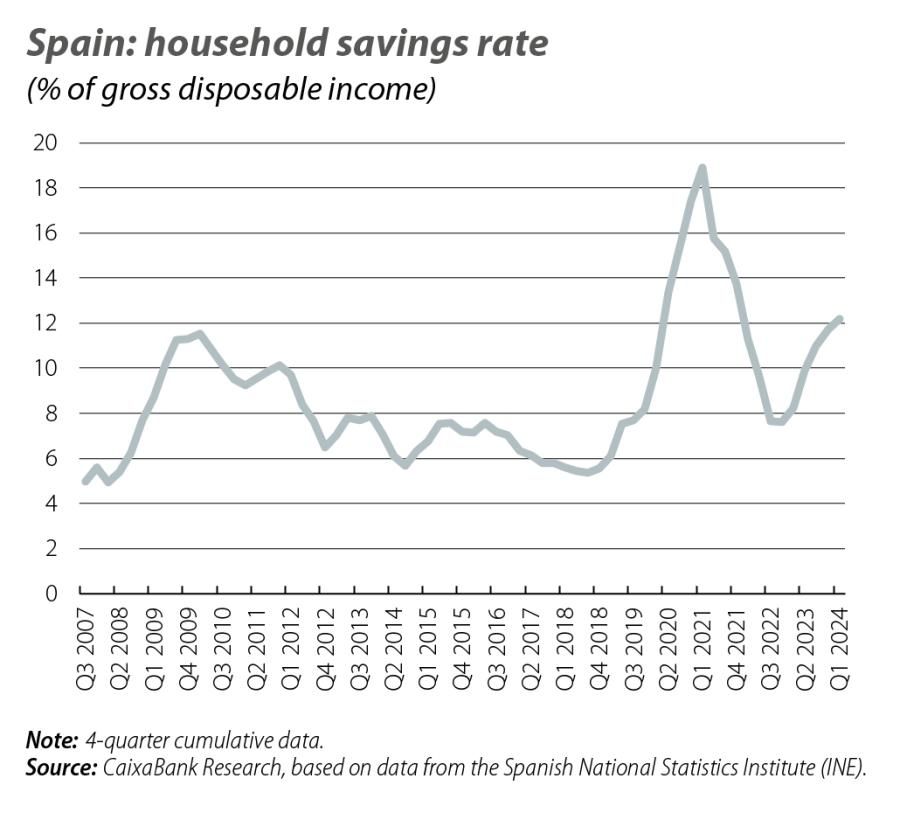
a result, the savings rate reached 11.7% of disposable income at the end of 2023, far exceeding the historical average of 6.7% recorded in the period 2014-2019. Several explanations have been proposed as to why consumption has experienced more modest growth than income. In this article we start by describing the pattern observed in Q1 2024, before offering some clues that may help us to understand what is going on.
The data for Q1 2024 confirm that the gap between disposable income and consumption has continued and this has provided a new boost to the savings rate. In particular, nominal disposable income grew by a significant 8.0% year-on-year,1 despite its moderation with respect to 2023, while final household consumption expenditure rose by 5.3% year-on-year. As a result, the household savings rate climbed to 12.2% of income in the total for the last four quarters, 50 basis points higher than where it stood at the end of 2023. This increase in savings can also be seen if we focus on the stagnant figure for Q1: gross savings stood at 14 billion euros, twice as high as in Q1 2023. This figure is significant, since Q1 tends to be a period of low savings. After all, together with Q4, it is traditionally the time of the year with the highest level of consumption; in fact, gross savings were negative in all of the first quarters between 2005 and 2019.
- 1The data throughout the article is presented before any seasonal adjustments, except for the fourth chart, which shows seasonally adjusted data.
What is driving disposable income?
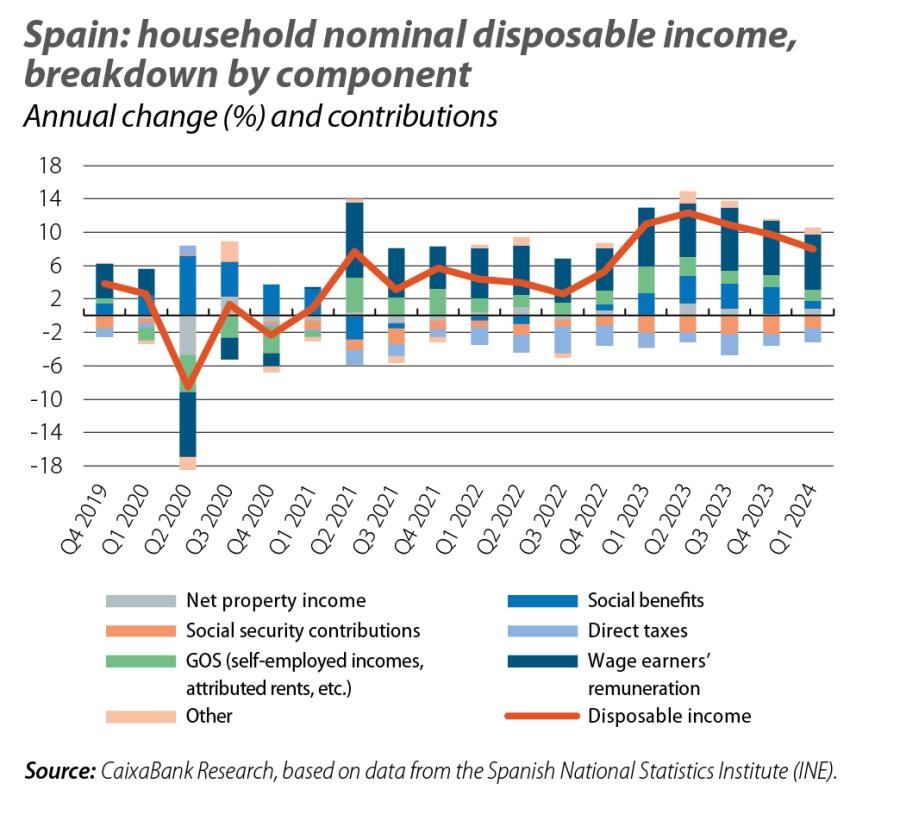
The growth in nominal disposable income of 8.0% is largely explained by the recent strength of the labour market. In particular, in Q1, wage earners’ remuneration rose by 8.3% year-on-year, and this increase was broken down into a 3.8% year-on-year increase in the number of people in full-time employment and a 4.5% increase in wages per person. Also of note is the good performance of net property income. This was thanks to an increase in incomes distributed by companies which more than offset the rise in rates, with a year-on-year increase of 54.7%, as well as a gross operating surplus, which includes self-employed workers’ income and attributed rents (+5.8%). Despite these excellent figures, the growth of disposable income has nevertheless gradually moderated in the last year: in the first half of 2023 it grew by 11.7% year-on-year; in Q2 it grew by 10.3% year-on-year; and in Q1 2024, by the aforementioned 8.0%. The main reason for this moderation is the increase in payments to the public sector: a year ago, direct taxes and social security contributions net of benefit payments accounted for 1.2 pps of disposable income, compared to 2.2 pps today.
It should be borne in mind that one of the reasons behind the increase in nominal disposable income
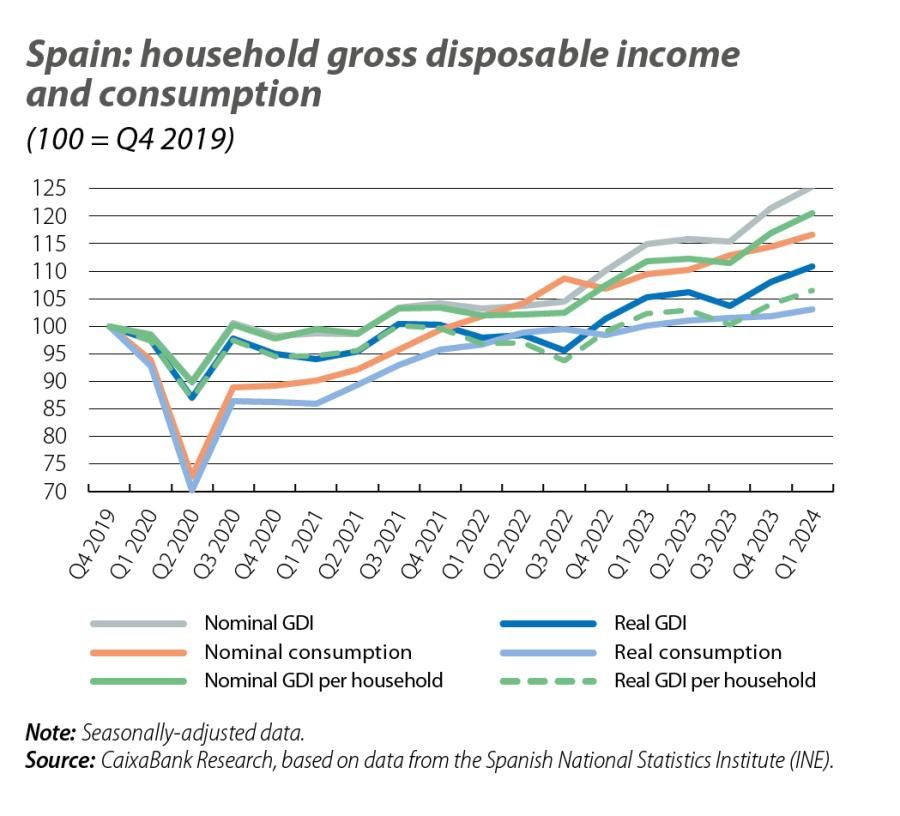
– a variable measured at the aggregate level – is the increase in the population spurred by migratory flows. Specifically, in the twelve months to Q1 2024, the population grew by 492,560 people, driven by a rise in the population born abroad of 558,652 people.2 This population increase has led to the creation of households, which grew by around 1% year-on-year in Q1 2024.3 In this regard, it is interesting to analyse whether the buoyancy of nominal disposable income is also observed in disposable income per household, given the increase in household creation. We observe that, in fact, this variable increased by 6.6% year-on-year in Q1 2024, only slightly below the growth of aggregate income. Finally, when we look at real disposable income per household, in order to take into account changes in the purchasing power of that income in the face of price increases, we see that it has indeed increased by a significant 3.4% year-on-year. In other words, Spanish households are recovering their purchasing power, and sooner or later this ought to be reflected in consumption. Compared to the pre-pandemic period, both nominal disposable income per household and real disposable income per household are already much higher (see fourth chart).
Where are savings being allocated?
At the aggregate level, over the past few quarters, households have significantly increased their savings, especially in response to an environment of relatively high interest rates. Thus, there has been an increase in the acquisition of financial assets and a reduction in debt in order to weather the rate hikes.
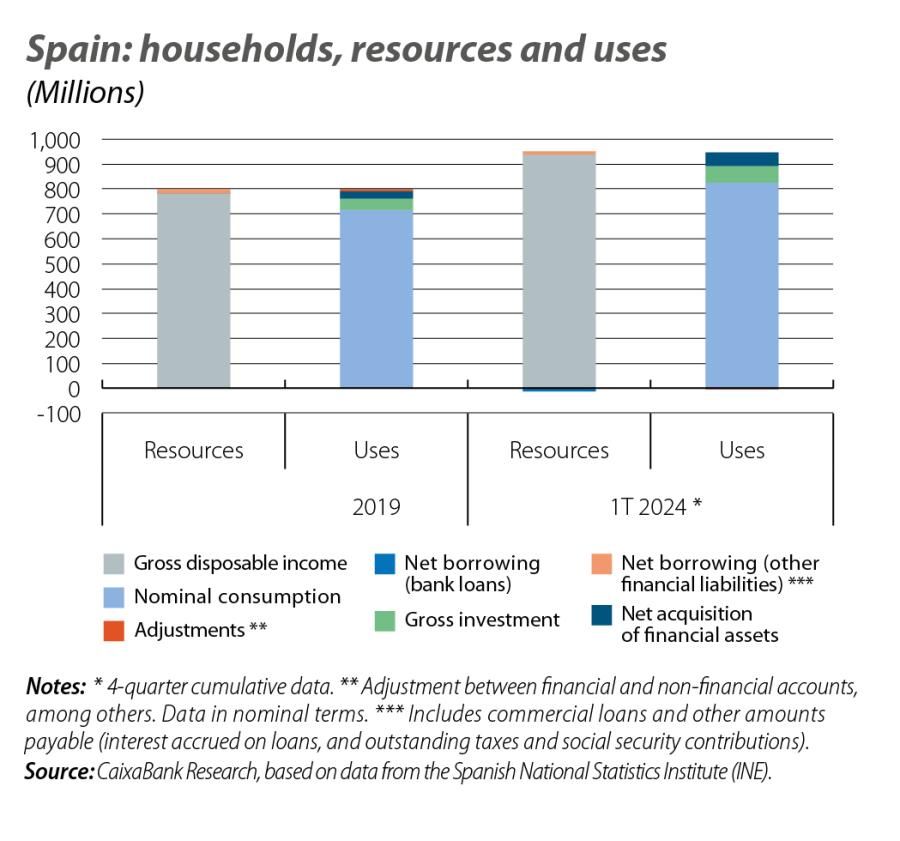
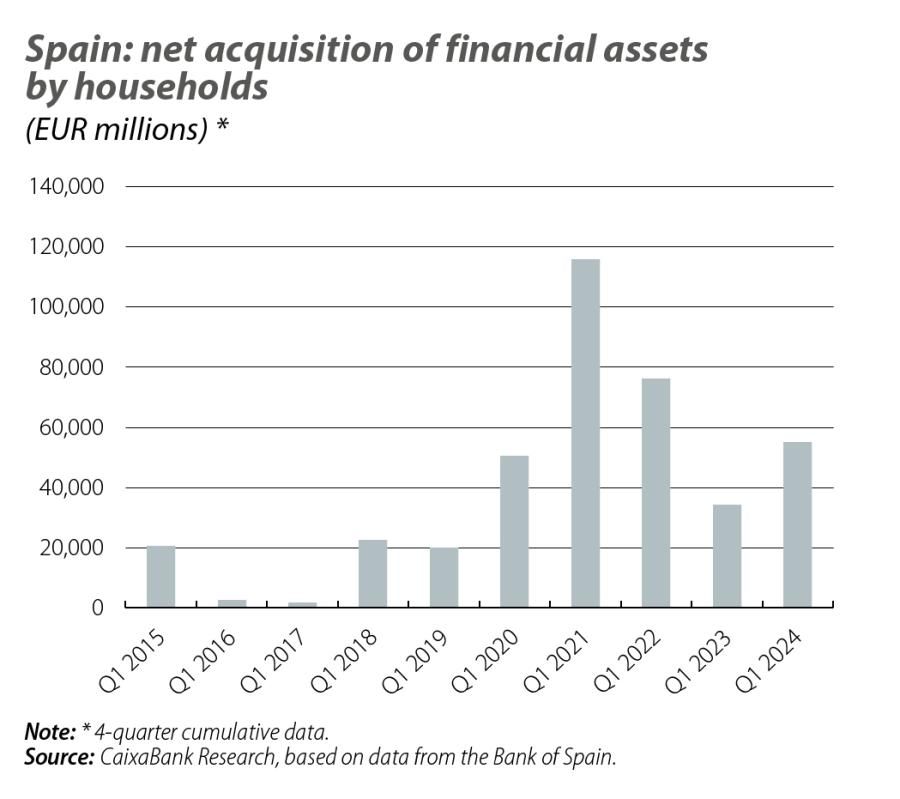
The net acquisition of financial assets on the part of households amounted to +55 billion euros in four-quarter cumulative terms through to Q1 2024, compared to a Q1 average of just under 13.5 billion during the period 2015-2019.4 Specifically, in net terms they acquired deposits and cash amounting to 12.385 billion (5.144 billion Q1 average in 2015-2019), investment funds for 23 billion (20.340 billion Q1 average in 2015-2019), debt securities for 14.923 billion (–10.369 billion euros average in Q1 2015-2019), and insurance and pension plans for 4.770 billion euros (5.466 billion euros in Q1 2015-2019). In the coming quarters, we can expect household incomes to continue enjoying dynamic grow and purchasing power to steadily recover. This, combined with the reduction in interest rates, ought to facilitate more dynamic consumption.
- 4Four-quarter cumulative data.
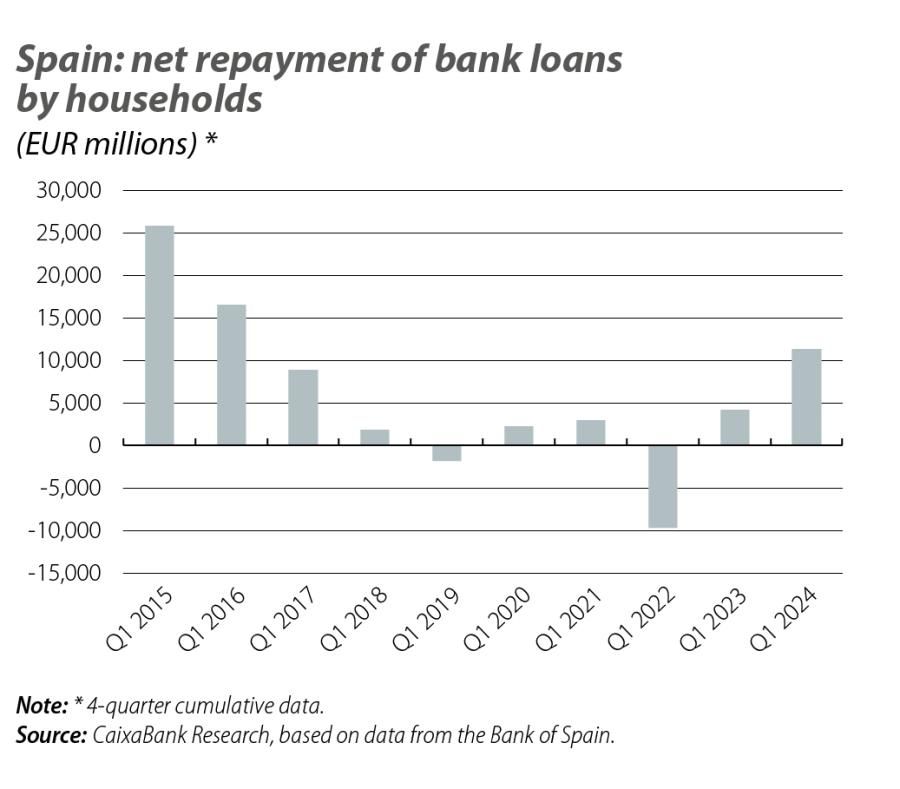
On the other hand, households continued to deleverage in Q1 2024, reducing their debt in the last year by 4.4 points of GDP to 46%, the lowest level since the first half of 2001. This debt level is 7.3 points lower than that of the euro area. After all, as a result of the rate hikes, households prolonged the trend that began in the second half of 2022 and used their greater savings to make net repayments of bank loans to the tune of 11.357 billion euros,5 compared to an average of 10.3 billion in the first quarters of the period 2015-2019.
As a result of the increase in the net acquisition of financial assets and the fall in debt, coupled with a significant revaluation effect on financial assets amounting to 125 billion euros in the past year, net household financial wealth has risen by 190 billion euros compared to Q1 2023, placing it at a new all-time peak of just over 2.14 trillion euros.
- 5Four-quarter cumulative data.
