Methodology note: CaixaBank Research Sectoral Indicator
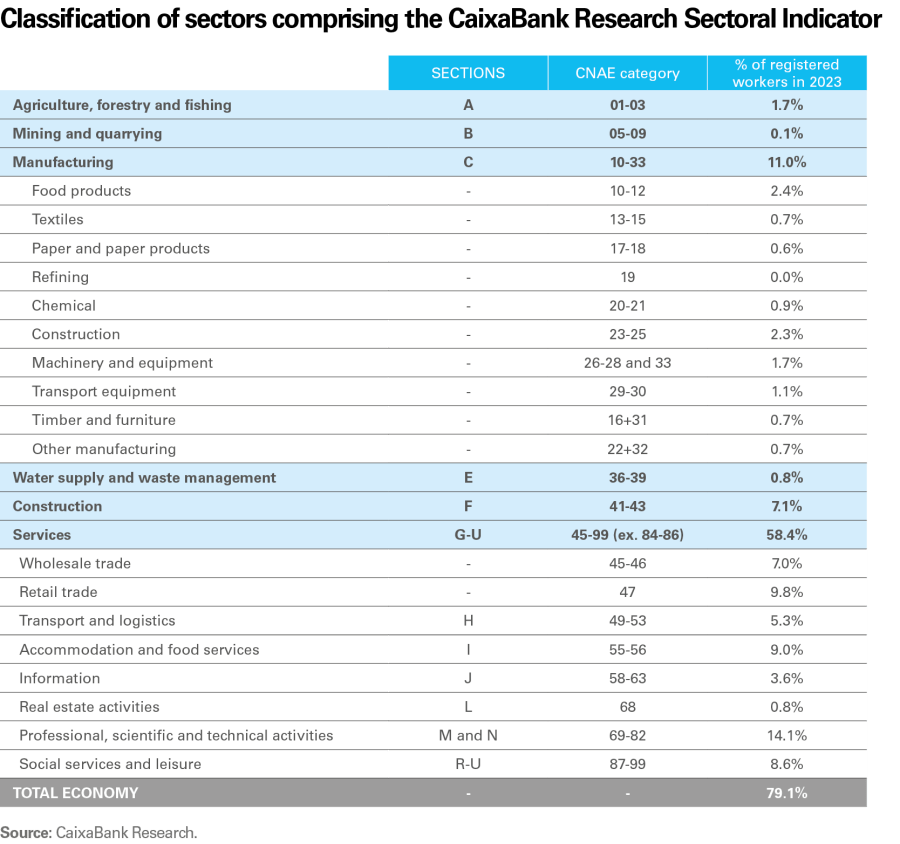
The CaixaBank Research Sectoral Indicator is a synthetic indicator that encompasses information from 17 variables into a single indicator. It is a monthly indicator and it compiles data dating back to January 2011. It is calculated for 24 economic sectors, including the four major ones: agriculture, forestry and fishing, manufacturing, construction and services.
The CaixaBank Research Sectoral Indicator is a synthetic indicator that encompasses information from 17 variables into a single indicator. It is a monthly indicator and it compiles data dating back to January 2011. It is calculated for 24 economic sectors, including the four major ones: agriculture, forestry and fishing, manufacturing, construction and services. Within manufacturing there is a breakdown of 10 sub-sectors: agrifood, textiles, paper and paper products, oil refining, chemical, construction, machinery and equipment, transport equipment, timber and furniture, and others. Within services, 8 sub-sectors are considered: wholesale trade, retail trade, transport and logistics, accommodation and food services, information, real estate activities, professional, scientific and technical activities, and social services and leisure. The indicator is also available for mining and quarrying and water supply and waste management. The following table shows the sectors that are considered in the indicator and their correspondence with the CNAE classification of economic activities.6
- 6The branches not included are: energy supply (section D) within industry; and, within services, the financial sector (section K), general government and defence (section O), education (section P) and health activities (CNAE category 86).
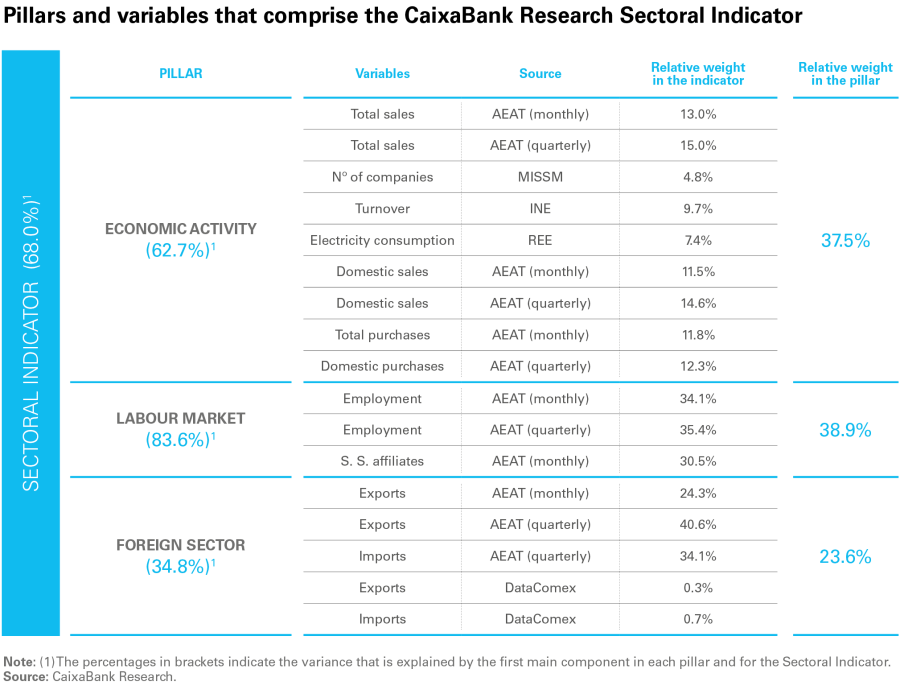
The 17 variables that make up the indicator are grouped into three pillars, allowing us to analyse the contribution of each of these spheres to the performance of each economic sector:
- Pillar 1: Economic activity (9 variables)
- Pillar 2: Labour market (3 variables)
- Pillar 3: Foreign sector (5 variables)
To reduce the scale of this dataset, an analysis of the main components is performed. First, for each variable, the year-on-year change is calculated and standardised. Next, a main component is calculated for each pillar and, subsequently, the synthetic indicator is calculated as the first main component of these three pillars. The following table summarises the indicators used, how they are grouped according to the different pillars, the data source used, the relative weight of each variable within each pillar and the weight of each pillar in the CaixaBank Research Sectoral Indicator (in both cases, these relative weights are obtained from the result of the main component analysis).
The data for each variable is incorporated into month t as they are published, such that the value for any given month is subject to revision until all the variables have been incorporated.7
- 7The number of days that pass between the month of reference (t) and the publication of the data varies depending on the indicator: Number of registered workers affiliated with Social Security: t + 2 days; Spanish Tax Agency (AEAT): t + 40 days; Turnover: t + 55 days; DataComex: t + 80 days.