Market predictability is a key issue in finance. Investors devote a considerable amount of time and effort to identifying factors that can help them predict how assets will perform and make investment decisions with such information. Short selling is one of these indicators.
The most typical case of short selling is the sale, at their current market price (e.g. 100 euros), of securities that are not owned by the seller but borrowed from another investor to whom they must be returned after a period of time.1 Short sellers are motivated by the belief that these securities' price will decline, enabling them to be bought back at a lower price (e.g. 90 euros). Assuming the cost of borrowing the securities is 6 euros, short sellers will make a total profit of 4 euros (or a 67% return on the cost of 6 euros incurred for borrowing the securities). An increase in this kind of short selling, which is speculative in nature, would reflect a downward sentiment which, if accurate, would anticipate a drop in asset prices.
However, short selling can also be due to other reasons. For example, to hedge positions already held in order to limit losses. Normally, if shares you own are likely to drop in price, you can reduce this position by selling part of your shares. But often investors prefer to maintain the number of shares, albeit temporarily, so as not to lose out on any political rights or dividends paid.
Short selling has often been blamed for contributing to market instability. Most studies,2 however, conclude that short selling might not only reduce market volatility but also contribute to its liquidity and also its efficiency by identifying overvalued assets.
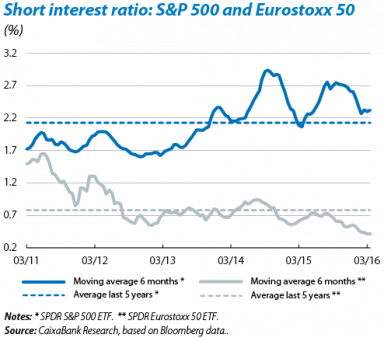
Over time, the practice of short selling has increased, supported, among other things, by lower transaction costs and greater access to the financial information of quoted companies. The short interest ratio (SIR), which results from dividing the number of tradeable shares being shorted by the market's average daily trading volume of available shares (free float), reflects this trend. Rapach et al.3 estimate that, in the 1970s, the SIR for the S&P 500 was 0.31% while it has come close to 5% in the last 10 years. As can be seen in the graph, the current SIRs for two of the most representative funds for the S&P 500 (SPDR S&P500 ETF) and Eurostoxx 50 (SPDR Euro Stoxx 50 ETF) are 2.6% and 0.5% compared with an average in the last five years of 2.1% and 0.8%, respectively. It therefore seems that downward sentiment is more present in the US stock market than in the European market.
Academic literature has provided several studies on the relationship between short selling and variations in share prices. A large number of these point to the SIR being a very good predictor of negative returns, better than other indicators such as the dividend yield, the book to market value or the price to earnings ratio. Indeed, a strategy consisting on short selling shares with high SIRs and buying shares with low SIRs would achieve above average returns.
It comes as no surprise that there is now a consensus view of short sellers as relatively sophisticated investors capable of identifying overvalued assets. However, we must not forget that this is a risky strategy that can incur significant losses should the expected drop in share price not come about. In particular, when short sellers attempt to close positions at the same time, they themselves push up the price of the share which they were expecting to fall (a short squeeze) and may escalate losses.
1. One variant is the naked short sale in which an asset is sold before it is borrowed.
2. Lamont, O. and Stein, J. (2004) «Aggregate Short Interest and Market Valuations», American Economic Review, vol. 94, 2.
3. Rapach, D., Ringgenberg, M. and Zhou, G. (2016) «Short Interest and Aggregate Stock Return», Journal of Financial Economics.
