Exposure of the European economy to a US tariff hike
One of Donald Trump’s big proposals during the campaign that helped propel him to the US presidency was the introduction of a universal tariff of between 10% and 20% on imports of goods. How could this affect Europe?

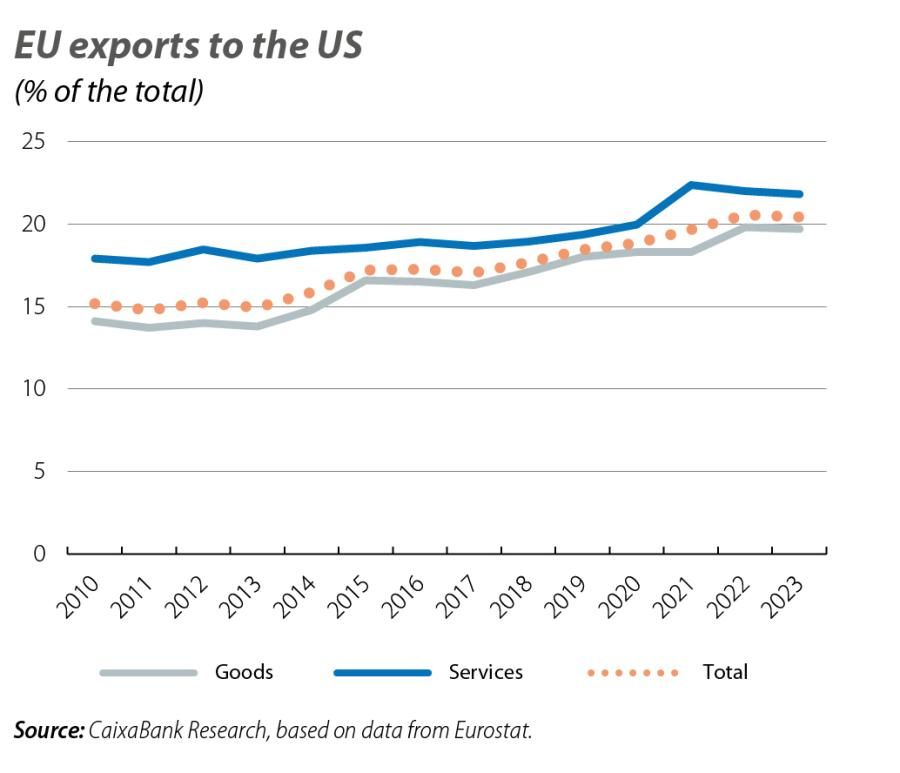
EU exports to the US have grown significantly over the last 15 years, going from 15% of Europe’s total exports to the rest of the world in 2010 to over 20% in 2023 (see first chart).1 This pattern, together with a greater buoyancy of foreign trade relative to the economy as a whole, has led to exports to the US representing around 5% of EU GDP, compared to a starting point below 3%. Exports of goods, which would be the focus of the new US administration’s protectionist measures, account for just over 60% of all sales to the US market. Service exports, meanwhile, have been gradually gaining prominence over the past 15 years and their exposure to the US is higher, at around 22%, compared to just under 20% in the case of goods.
- 1. In the text, when referring to the EU, we exclusively consider exports to the rest of the world, while when we talk about member countries we also include intra-EU trade.
Within the EU, the proportion of exports that are destined for the US varies widely from country to country (including, in this case, those going to other Member States). Ireland is the country with by far the largest share of its exports of goods going to the US, at over 25%, while the share of the US market is generally lower for the countries of Eastern Europe, where value chains are more integrated within the single market. Among the large economies, Italy and Germany show values of around 10%, exceeding those of France, at 7%, and Spain, which is below 5%. Differences are also observed in service exports, albeit to a lesser extent. Besides international tourism revenues, these exports mostly include business services that could potentially also be subject to protectionist measures in the future. In this case, Cyprus, Germany and Finland have the highest percentages, at above 15%, while Spain once again has the lowest value among the bloc’s major economies, at 8%.
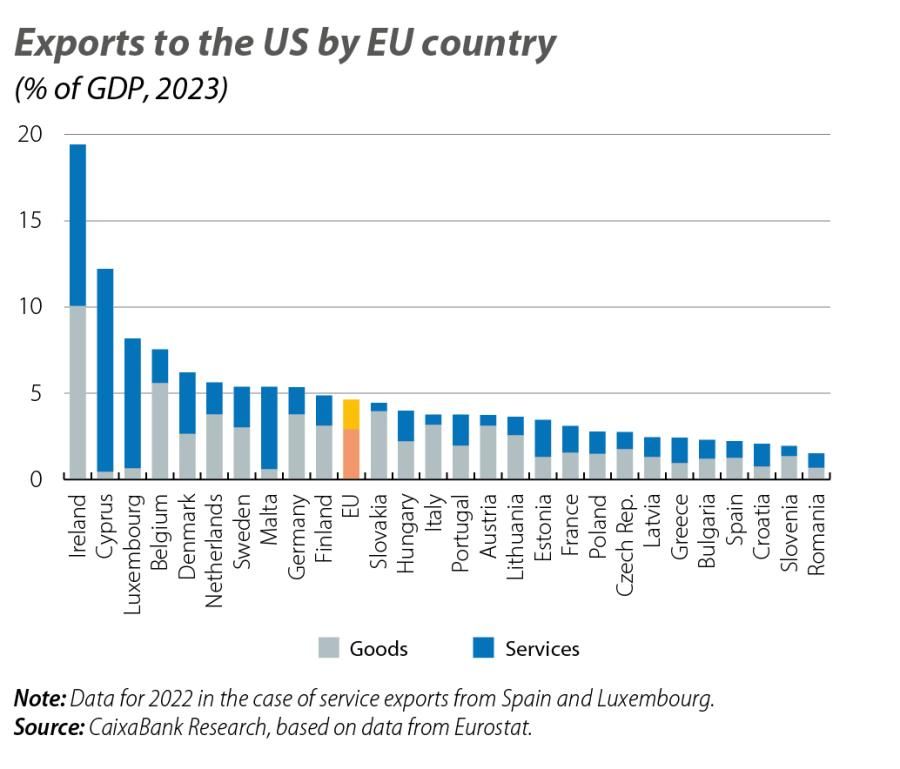
The share of total exports that go to the US market, together with the degree to which an economy is trade-oriented, determines the importance of the US market in terms of each country’s GDP (see second chart). In this regard, we note that Ireland is highly dependent on the US if we consider its exports of goods and services together, as the US market represents around 20% of the country’s GDP. After Ireland, other countries that are above the EU average include three small economies that are highly dependent on the US due to the provision of international services (Cyprus, Luxembourg and Malta), as well as Belgium, the Netherlands and Slovakia in exports of goods. Germany has a greater exposure to the US than the other major economies, at over 5% of GDP, followed by Italy (around 4%), France (3%) and Spain (just over 2%).
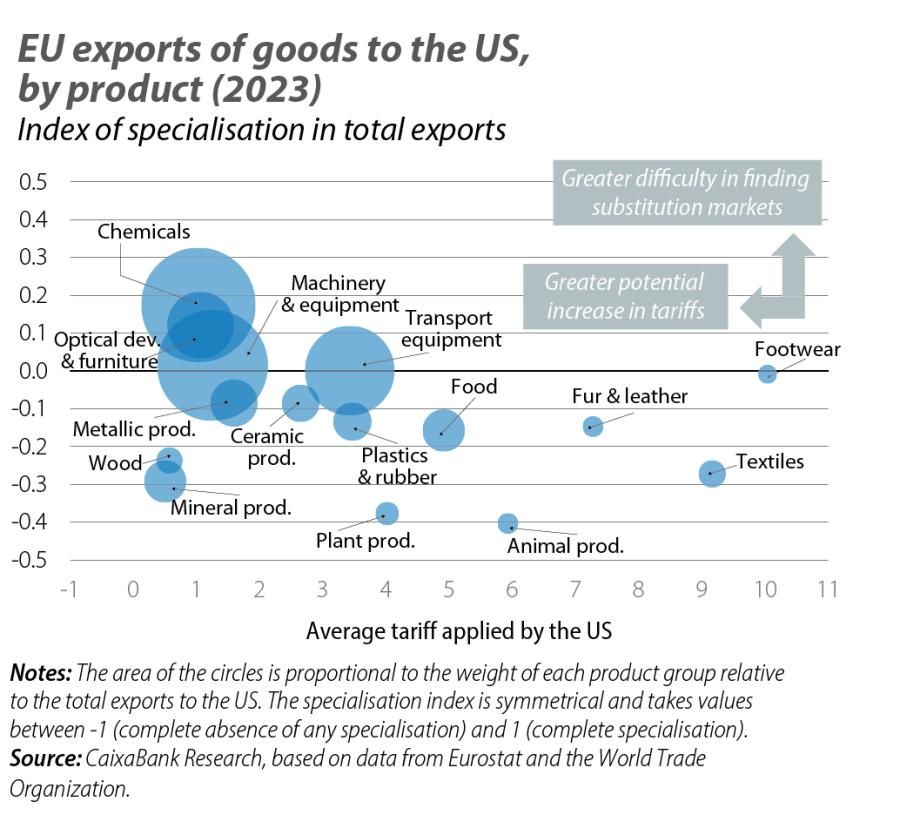
Establishing a blanket tariff on US imports of goods of between 10% and 20% would entail a significant increase relative to current levels, given the average tariff is around 2% considering the structure of exports from the EU to the US market.2 By product (see third chart), the chemicals industry is more vulnerable a priori, as it combines an initial tariff of around 1% and a high degree of specialisation, as its sales to the US market represent a larger proportion of its exports than in the case of all exports as a whole (26% versus 19% in 2023, respectively).3 However, the final effect will depend on the elasticity of US importers’ demand to the tariff hikes, as well as the ability of European exporting companies to sell their products in the US through direct investment or to replace this destination with other international markets. The group of products that includes optical devices and furniture is in a similar situation, albeit with a lower share (around 10%). The two other major product categories, machinery and equipment, and transport material, which account for 40% of all exports to the US, also have low starting tariffs, although they may have fewer difficulties finding alternative markets.
- 2. For this calculation we combine data at the two-digit level of detail from the HS classification of tariffs applied by the US for the most favoured nation, taken from the World Trade Organization, and data from Eurostat on exports of goods.
- 3. A product’s degree of specialisation is measured using a symmetric index (between –1 and 1), based on the classic indicator of revealed comparative advantage, equivalent to dividing the share of that product’s exports to a given destination relative to the share for all exports.
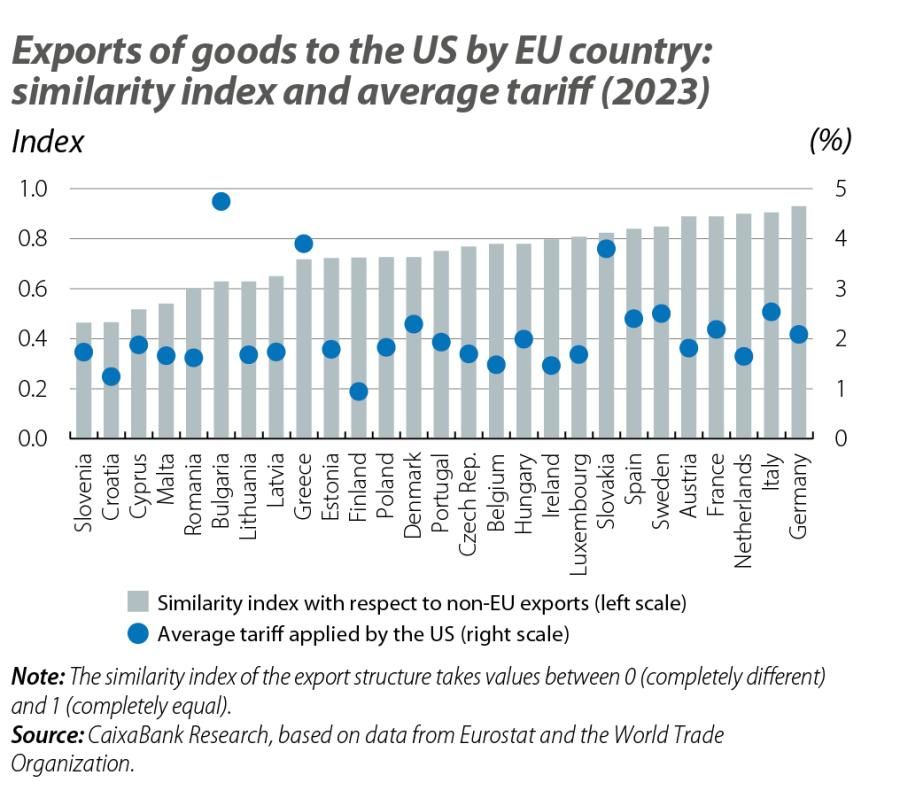
By country, with the exception of a few specific cases which differ slightly, the average starting tariff is low for all Member States (see fourth chart), although their degree of specialisation varies widely.4 For instance, several Eastern European countries export different products to the US market to those which they sell to other non-EU destinations. This, a priori, is indicative of greater difficulties in diverting these sales to other international markets, although the relevance of these countries’ exports to the US is limited, as noted above. In contrast, the large economies, particularly Germany and Italy, are among those with the greatest similarity in their export structures. This suggests that, for the EU as a whole, the difficulty in substituting exports would be limited to the chemicals industry and some specific machinery and equipment products.
- 4. A country’s degree of specialisation is measured using a symmetric index of similarity (between 0 and 1) of the product structure between exports to the US and the total exports to outside the EU. The index is the result of adding together the differences in absolute terms of the export shares for each product.
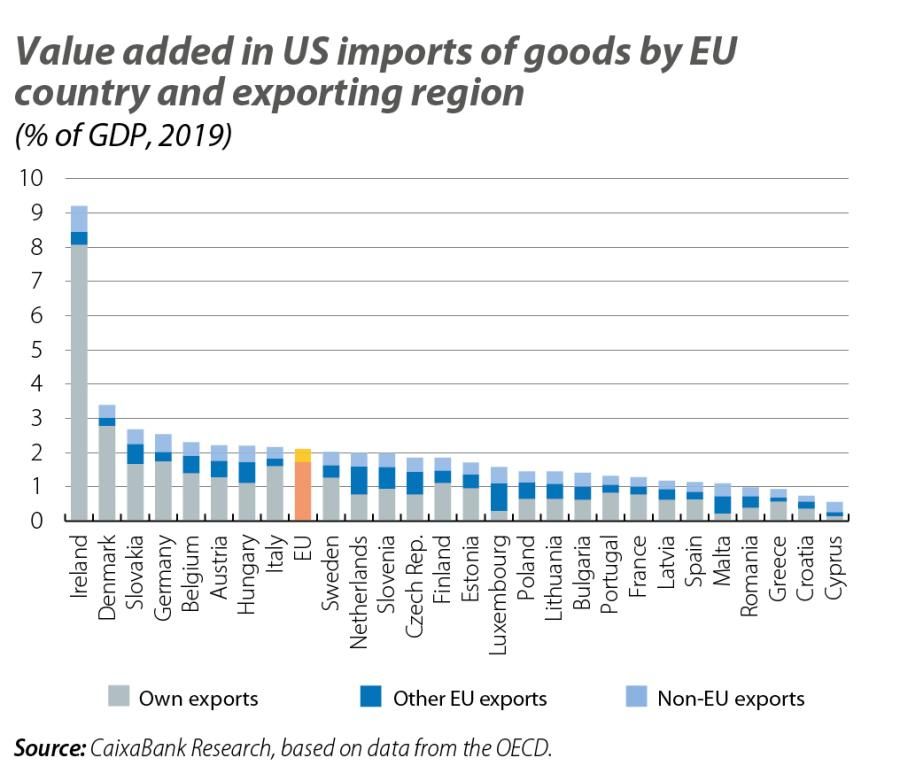
Raising tariffs on the trade of goods directly impacts the competitiveness of exporting companies, but the effects are also felt indirectly across the economy as a whole. Thus, European countries’ primary sectors, extractive industries and manufacturing companies that sell their products in the US exert a significant spillover effect on their domestic productive sectors, as well as on those of other Member States, through the purchase of intermediate goods and services. For example, according to OECD data,5 around 10%-15% of the value added of European countries’ exports is generated in other EU Member States, while around a third of the value added in the exports of goods corresponds to branches of services, particularly trade, transport and professional activities. Similarly, exporters of goods to the US in third countries incorporate EU intermediate products (goods and services), equivalent to 20% of the value added in the EU through global exports of goods to the US market (see fifth chart). With all this, assessing the EU’s exposure to the new US administration’s potential tariff hikes becomes a somewhat more complicated task than the gross export figures above would suggest, and a more detailed analysis is needed in order to evaluate the risks to the European economy.
- 5. See OECD, Trade in value-added.
