Financial volatility and political uncertainty: who says there is fear?
Over the past few months, one of the major issues in macrofinance has been the coexistence of financial volatility at an all-time low and high political uncertainty. But should we be surprised by this apparent paradox? Just how closely are financial volatility and political risk related?
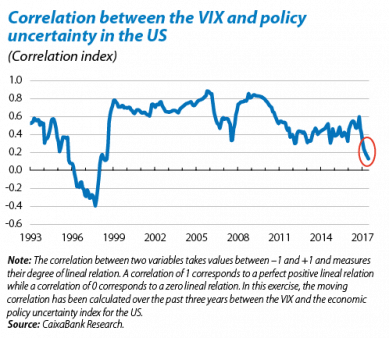
The most widely used indicator to measure financial volatility on the US stock market is the VIX, commonly known as the «fear index», which measures the implied volatility of S&P 500 index options. As can be seen in the first chart, the gap between the economic policy uncertainty index for the US and the VIX reached a peak in January, when Donald Trump took office. Since then it has fallen slightly. In fact, this gap is currently narrower than the level reached in two relatively recent episodes: the «fiscal cliff»1 at the end of 2012 and the US federal government shutdown in 2013 after budget negotiations failed. This recent narrowing of the gap is mainly due to a 39% drop in the US policy uncertainty index between January and June. Nevertheless, policy uncertainty is still relatively high.
A more rigorous and sophisticated way of gauging to what extent the VIX is abnormally low given the current levels of political uncertainty is to compare the observed VIX with the VIX predicted by US and global indices of policy uncertainty. When this is carried out, we can see that, since July 2016, the VIX predicted by political factors vastly overestimates the actual volatility observed.
There are two other factors that are also presumably related to the decline in the VIX: macroeconomic and financial conditions. If we carry out the same exercise and compare the observed VIX with the VIX predicted by macrofinancial conditions,2 we can see that the predicted VIX is closer to the VIX observed over the past few months. For instance, the predicted VIX based on political uncertainty had a prediction error of 5.9 points in June compared with an error of just 2.86 points in the prediction made based on macrofinancial conditions.
If we look closely at the trend in the observed VIX and the predicted VIX in the second chart, it seems that, between 2003 and 2007, the predicted VIX based on policy uncertainty was relatively similar to the observed VIX while, since 2012, macrofinancial conditions have predicted a trend much more similar to that of the VIX. To check whether this is the case, we have divided the sample into three periods: from 2003 to 2007, from 2008 to 2011 and from 2012 to 2017. We have also analysed the policy, macroeconomic and financial factors that lie behind financial volatility. 3The findings leave no room for doubt: policy factors accounted for 74% of the explained variance in the VIX between 2003 and 2007 but only 12.5% between 2012 and 2017. The relative weight of macroeconomic factors and especially of financial factors was also greater between 2008 and 2017 than between 2003 and 2007. We should also note the decline in the explained variance of the VIX over the past few years. The explanatory power of political and macrofinancial factors was 76% between 2003 and 2007, and 89% between 2008 and 2011. But this figure was just 47% between 2012 and 2017. This suggests that factors unrelated to political uncertainty, macroeconomic variables or the index for financial conditions currently lie behind a larger percentage of the VIX variation.
These findings may look surprising at first sight but they become plausible when other elements are also taken into account. On the one hand, political uncertainty may have lost some of its influence on financial volatility because, as shown by the Chicago University economists Pastor and Veronesi,4 political news are now less reliable and policy signals have become noisier. The difficulty in interpreting political information accurately might have led investors to react less to political events even when there is greater uncertainty.
On the other hand, financial variables may have gained relative weight over political factors in the period 2008-2017 compared with 2003-2007 due to unconventional monetary policies (for instance, the first US quantitative easing programme, QE1, began at the end of 2008).
The Fed’s massive bond buying programmes have increased liquidity in the financial system, pushing up the price of some financial assets as well as reducing fears of sharp slumps in these prices, thereby decreasing volatility.5
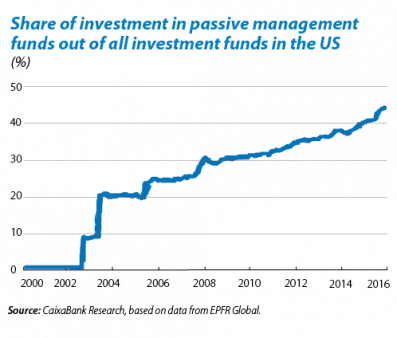
Macrofinancial elements also seem to be related to the decrease in the explained variance of the VIX between 2012 and 2017. In particular, the recent increase in passive management funds6 could have been a relevant factor. These funds track a specific index and therefore reduce the capital bought and sold on a daily basis on the financial markets. One consequence could be that financial volatility has become less sensitive to certain macroeconomic and financial fluctuations.
1. When automatic increases in taxes were coupled with massive spending cuts by the US government to reduce the federal deficit.
2. The macroeconomic variables included are the US business sentiment index (ISM) and a measure of global macroeconomic volatility based on the index of economic surprises for the G-10. Financial conditions were measured using the financial index elaborated by the Federal Reserve of Chicago.
3. The formula for the lineal regression is as follows:
\(VIX_t=\beta\ast EPU_t+\gamma\ast CM_t\ast+\alpha\ast IFC_t+\varepsilon_t\).Where EPUt is the vector of economic policy uncertainty indices by Baker, Bloom and Davis for the US and the world, CMt is the vector of macroeconomic variables detailed in note 2, and IFCt is the index for financial conditions. Lastly, εt is a random error term.
4. See Pastor, L. and Veronesi, P. (2017), «Explaining the puzzle of high policy uncertainty and low market volatility», VOX Column.
5. For more details, see Mallick, S., Mohanty, M. S. and Zampolli, F. (2017), «Market volatility, monetary policy and the term premium», BIS Working Papers.
6. The passive management of investment portfolios is an investing strategy, for bonds or equity, that replicattes the evolution of a specific index. In the US they account for almost half of the capital managed by investment funds and 14% of the stock market value.


