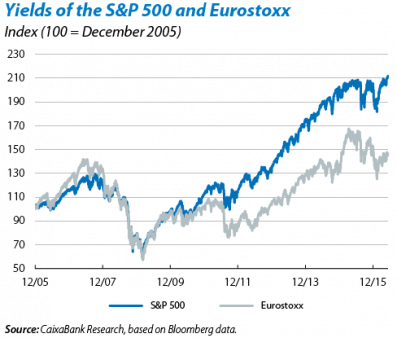
Over the last few years, recommendations for shares to buy on Europe's stock exchange have abounded, arguing that there are more potential gains than in the US stock market. At the same time there have also been warnings about the rise in price of US equity. Nevertheless, European shares have not managed to keep up with US shares.
The main stock market indices on both sides of the Atlantic, the S&P 500 and Eurostoxx, have performed quite differently between the beginning of 2010 and mid-June 2016. In this period, the S&P 500 rose by 117.7% while Eurostoxx only gained 49.3%. The correlation between their monthly performances during this period is still high (80%) although below the level recorded in the period 2000-2009 (87%). Rallying early in 2015, European shares closed part of this gap in yield but losses in the summer of 2015 and at the beginning of 2016 have hit stock markets on the Old Continent harder. Note that these figures refer to total return indices which include dividend payments. But even when dividends are not included, Europe still comes off worse in the comparison because it distributes a larger percentage of profits (61.1% compared with 41% in the US) and the dividend yield is higher (3.7% compared with 2.0%).
Underlying economic fundamentals are probably the main factor behind this gap between the two stock markets. Since 2010 average GDP growth in the euro area has been 0.9% year-on-year while it has been 2.1% in the US. This is directly reflected in companies' earnings per share (EPS) which has grown, on average and over the same period, by 9.4% year-on-year in the US compared with 2.9% in the euro area. But the impact of the regions' respective monetary policies is no less important. Both in its expansion of its balance sheet and in lowering interest rates, the Federal Reserve (Fed) has acted more quickly and more aggressively than the ECB, benefitting US equity. Moreover the euro area has had to tackle significant local episodes of risk aversion, such as the sovereign debt crisis and, more recently, the Brexit referendum.
On the other hand, a clear pattern emerges when we analyse the performance of both markets by sector. As can be seen in the table, Europe has lost the battle with the US in all sectors; those related to consumption, health and technology have achieved good results but have still been outperformed by their American peers. The other side of the coin can be found in the financial sector, telecommunications and utilities, which have performed considerably worse than the corresponding sectors in the US market.
This weak performance by the European stock market has placed its valuation metrics at relatively attractive levels (euro area P/E ratio: 16.3; US P/E ratio: 25.8, at 15 June), with the Cyclically Adjusted Price to Earnings (CAPE) ratio allowing for larger gains in the long term. In fact, analysts predict a strong rise in profits in 2016 although historically they tend to be overly optimistic. However, much will depend on the repercussions of Brexit, the strength of Europe's political project, the effective implementation of structural reforms and regulation in key sectors.

