Wages in Spain, the same moderation for everyone?
The labour market in Spain has been exhibiting a notable rate of recovery over the past several years. In 2018, for example, there are nearly two million more people in employment than there were in 2013, and the unemployment rate has fallen by around 2 pps per year during this period. Despite this, the pace of wage growth has been relatively contained. According to data from the National Accounts, the remuneration per full-time employee has risen by 0.5% per annum on average between 2013 and 2018. This low wage growth is largely due to the high level of under-utilisation of the labour force, which is reflected both in the high rate of unemployment and in other indicators of underemployment, such as the high rate of involuntary part-time workers.1 Another factor that has contributed to low wage growth is the fact that inflation expectations have remained relatively low. But has this wage moderation been the same across the board?
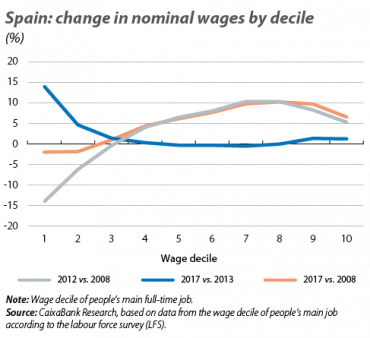
If we analyse the trend in wages ordered into deciles,2 we see that the apparent stability in wages hides differing trends across the spectrum. According to the National Statistics Institute, the median gross monthly wage of a full-time worker - i.e. the wage that half the labour force earns less than and the other half earns more than - was very similar in 2013 and in 2017 in nominal terms.3 However, the lowest wages followed a more positive trend: in 2017, the wage of the first decile (which marks the lowest 10% of wages) was 14% higher than in 2013, while the second decile was 4.6% higher. Therefore, since the beginning of the economic recovery, workers on lower wages are recovering some of the ground lost during the financial crisis.4
For the following deciles, in contrast, wages remained relatively stable between 2013 and 2017 (see first chart). In this case, however, wages had continued to increase during the financial crisis, particularly in the case of wages above the median, so the nominal wages in 2017 are still higher than they were in 2008. Specifically, those with a salary above the median wage saw their wages rise by 8.3% on average.5 Therefore, if we take the last 10 years as a benchmark, we can see that most of the wage reductions have affected those on lower wages.
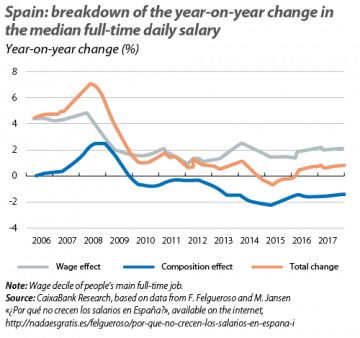
To better understand these dynamics, we must bear in mind that trends in wages also reflect changes in the composition of the labour force. Thus, another interesting perspective is to differentiate between those individuals who kept their jobs and those who lose or find work. This allows us to break down the change in wages into a purely wage effect (the change in wages for workers with constant characteristics) and a composition effect (the change in wages caused by wage differences between those starting or stopping work). As Felgueroso and Jansen show using data from the Continuous Work History Sample (known as the MCVL in Spanish),6 the median salaries of workers who did not change jobs increased fairly steadily by around 2% per annum between 2008 and 2017 (see the second chart). Therefore, it is the changes in the composition of the labour force, and in particular the entry of workers on wages below the median, which is causing wages to fall overall due to their composition. This also accounts for why the median wage has remained so contained.
If we focus on the most recent period, the trend in wages by decile in 2017 follows a different pattern to that of the recovery years (2013-2016). This change of trend could be connected with the greater polarisation of the labour market in many developed countries, where there is less demand for jobs in medium-wage occupations (usually jobs that are more susceptible to being automated),7 depressing wages around the median. In other words, wages rise more at the extremes of the spectrum, giving rise to a U-shaped pattern in the trend in wages (see the third chart).
What trend can we expect to see over the next few years? To the extent that the slack in the labour market is reduced and the inflation outlook increases, we can expect to see a gradual recovery in wages. Part of this positive trend can already be observed in the pay reviews agreed in collective agreements. The collective agreements with an economic impact in 2018 include an agreed pay increase of +1.69% on average (based on data up to October 2018), while those signed in 2018 include an increase of +1.97%, in line with what was agreed in the 2018-2020 Employment and Collective Bargaining Agreement (known as the AENC in Spanish).8 Nevertheless, we will have to closely monitor how this gradual recovery in wages materialises across the wage spectrum, and the most recent trends do not invite optimism.
1. For a detailed analysis see, for example, P. Cuadrado and F. Tagliati (2018), «La moderación salarial en España y en la UEM», Economic Bulletin 4/2018, Bank of Spain.
2. That is, ordering workers according to their salaries and dividing them into 10 equally-sized groups. The figures correspond to the wage decile of people’s main full-time job according to the labour force survey (LFS).
3. The nominal wage went from 1,503 euros in 2013 to 1,498 euros in 2017, a reduction of 0.3%. In real terms, the median wage fell by 1.4%.
4. In real terms, the loss of purchasing power between 2008 and 2017 was almost 11% for both groups.
5. In real terms, wages above the median have lost 1.1% of purchasing power between 2008 and 2017.
6. F. Felgueroso and M. Jansen «¿Por qué no crecen los salarios en España?», available on the internet, http://nadaesgratis.es/felgueroso/por-que-no-crecen-los-salarios-en-espana-i
7. For further detail, see, for example, the articles «Job polarisation in Spain» in the MR05/2015 and «Job polarisation in the euro area» in the MR07/2017.
8. The 2018-2020 State Collective Bargaining Agreement recommends a fixed wage increase of around 2%, plus a 1% variable increase linked to factors negotiated in the agreement, such as productivity.


