How financial conditions are withstanding tighter monetary policy: part II
Although the US Federal Reserve (Fed) has gradually raised the fed funds rate since the end of 2015, financial conditions have not become tighter. In fact, they are still very loose, as can be seen in the first chart. Is this paradox, presented in a recent Focus,1 an anomaly?
To answer this question, we will examine other times when the Fed has tightened its monetary policy stance. We will also see how, over the past few weeks, financial conditions have been somewhat tighter due to February’s stock market corrections.
Tighter monetary policy and financial conditions: evidence from the past
As we saw in the previous Focus, to analyse the state and trend of financial conditions we use Financial Conditions Indexes (FCI): indicators which summarise a range of financial asset prices and act as a «thermometer» to gauge whether the financial environment is favourable or unfavourable for economic performance. In the US, the index produced by the Federal Reserve Bank of Chicago is one of the benchmark «thermometers» and both its simple version, the NFCI, as its version adjusted for the business cycle, the ANFCI,2 show that the Fed’s interest rate hikes between December 2015 and December 2017 were, paradoxically, accompanied by looser financial conditions (see the first chart).
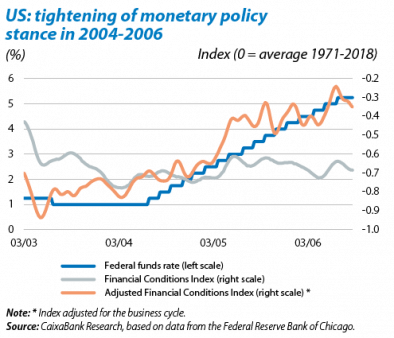
Such contrasting dynamics have not been seen in other episodes. The second chart compares the current episode with the previous four cycles of the Fed tightening its monetary policy stance. Given that, in each cycle, interest rates were raised by different amounts, the changes in the NFCI and ANFCI have been standardised by the total variation in the interest rate in each cycle. For instance, between February 1994 and February 1995, the Fed raised the benchmark rate by 275 bp and was accompanied by an increase in the NFCI of 0.29 points: around 10.5 bp for each 100-bp rise in the benchmark interest rate. Similarly, between July 1999 and May 2000, the Fed raised the fed funds rate by 150 bp and the NFCI increased by 0.19 points: around 12.9 bp for each 100-bp increase in the benchmark interest rate. In the next cycle, between 2004 and 2006, although the NFCI did not seem to be very sensitive to the Fed’s monetary policy stance, such sensitivity does appear if we look at the ANFCI, suggesting that the booming US economy played a key role in the failure of monetary policy to pass through to financial conditions (see also the third chart).
Finally, focusing on a selection of key financial variables (see the fourth chart), the current cycle of monetary policy tightening has three notable aspects: i) long-term interest rates are less sensitive to the Fed’s interest rate hikes, ii) corporate debt spreads are more compressed (especially lower quality corporate bonds) and iii) US stock markets are more bullish.
Recent stock market corrections and their impact on financial conditions
Lastly, since the end of January 2018, both the NFCI and ANFCI have pointed to financial conditions becoming tighter, a situation that started with the stock market corrections of the first fortnight of February 2018. When the previous Focus was written, the data showed that this deterioration in financial conditions was contained and almost entirely due to two indicators related to liquidity and stock market volatility. Since then this deterioration has continued to some extent but is still moderate. Nevertheless, and as can be seen in the fifth chart, in the past few weeks this has spread to other indicators, especially through higher risk premia on the cost of short-term debt in the interbank lending and commercial paper markets.
In short, in the previous four cycles, a close relationship can be seen between the trend in the Fed’s monetary policy stance and financial conditions. In contrast, the current cycle has three substantial differences in monetary policy terms that help to explain the decoupling observed. Firstly, the unconventional measures implemented by central banks, particularly asset purchases, promoted a low interest rate environment over a long period of time. Given that the Fed is reducing its balance sheet very gradually (while central banks from other regions, such as Europe and Japan, are still enlarging theirs), these measures are still having a significant effect. Secondly, the Fed is using a much more predictable and gradual strategy to tighten its monetary policy stance than in previous cycles. And, thirdly, the recent stock market corrections and consequent increase in the NFCI and ANFCI occurred precisely because investors more readily believed the strategy announced by the Fed and started to raise their interest rate expectations accordingly. From now on, this readjustment in expectations and the Fed’s reduction of its balance sheet should help any increases in the fed funds rate to be passed on more readily to financial conditions.
1. See the Focus «How financial conditions are withstanding tighter monetary policy» in MR03/2018.
2. The Adjusted National Financial Conditions Index (ANFCI) is the National Financial Conditions Index (NFCI) adjusted for the state of the economy. The ANFCI removes the impact of recent economic performance on current financial conditions and provides a financial «thermometer» as if the economy was always at the same point in the business cycle.


