The dynamics of services inflation in Spain
We review the recent dynamics in services inflation in Spain and their relationship with wages and energy, two key factors for understanding what pattern this component will follow in the coming months.

Over the past two years, the behavior of services inflation has been relegated to the background by the sharp rise in energy and food prices. However, in recent months services have contributed more to inflation than any other component. Moreover, they represent almost 50% of the basket of components of the CPI, which means they are holding back the speed at which headline inflation is converging on the 2% target. In this article, we review the recent dynamics in services inflation and their relationship with wages and energy, two key factors for understanding what pattern this component will follow in the coming months.
Recent dynamics
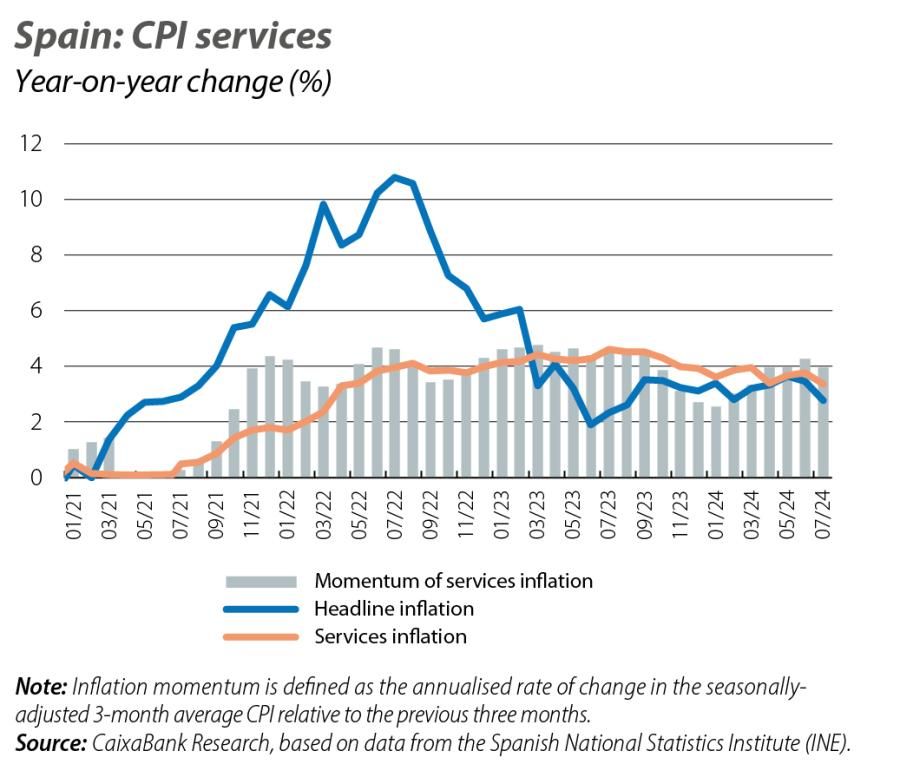
As we can see in the first chart, the services component has followed a much less volatile pattern than headline inflation. Inflation of this component began to climb in early 2022, reaching around 4.0%. Since then, it has fallen very little from that level, despite the fact that headline inflation has plummeted from an average of 8.4% in
2022 to 2.8% in July. In the same month, services inflation stood at 3.4%, while the momentum1 of services inflation – a measure less sensitive to monthly oscillations – stood 0.6 pps higher, thus indicating the greater resistance of this component in the disinflation process.
- 1Momentum is obtained by annualising the change in the seasonally-adjusted 3-month average CPI relative to the previous three months.

When analysing the dynamics of services inflation, we must bear in mind that this component encompasses services with very different price patterns, ranging from general services, to tourism services, to those regulated by the government.2
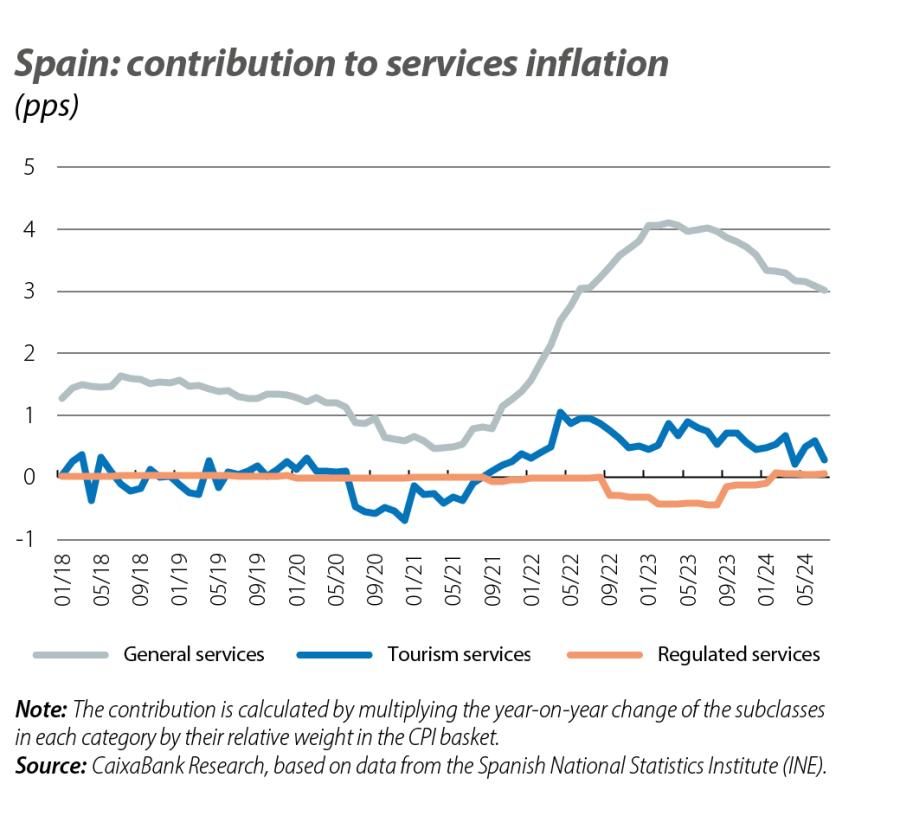
The second chart shows the contribution of each of these categories to total services inflation. Services of a general nature contribute more to services inflation and show more persistence than tourism services.3,4 As we can see, services inflation has been marked by two opposing trends: while the contribution of general services has diminished over the past year and a half, that of tourism services has declined to a lesser extent. In July, general services showed an inflation rate of 3.4% and they contributed 3 pps to the 3.4% inflation recorded by all services as a whole (representing 88% of the total). Inflation of tourism services, meanwhile, stood at 4.2% and contributed 0.3 pps (9% of the total).
- 2Given the discretionary nature of the latter group, we will focus our analysis on the first two.
- 3General services account for 87% of the CPI basket of all services, while tourism and regulated services represent 7% and 6%, respectively.
- 4The tourism services category includes air and sea transportation, tour packages, accommodation and recreational services.

The factors behind services inflation
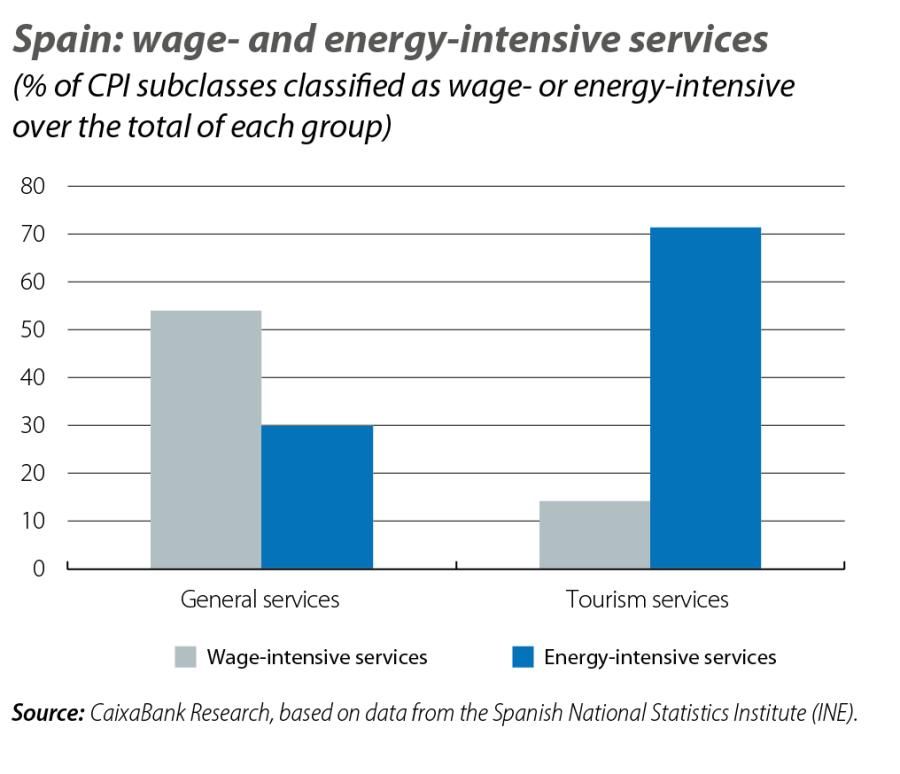
The disparate pattern of inflation between general services and tourism services is largely explained by the differing trends in demand, as well as by their differing cost structures. In particular, energy costs have a greater weight in tourism services, while in the case of general services the main cost component is wages.

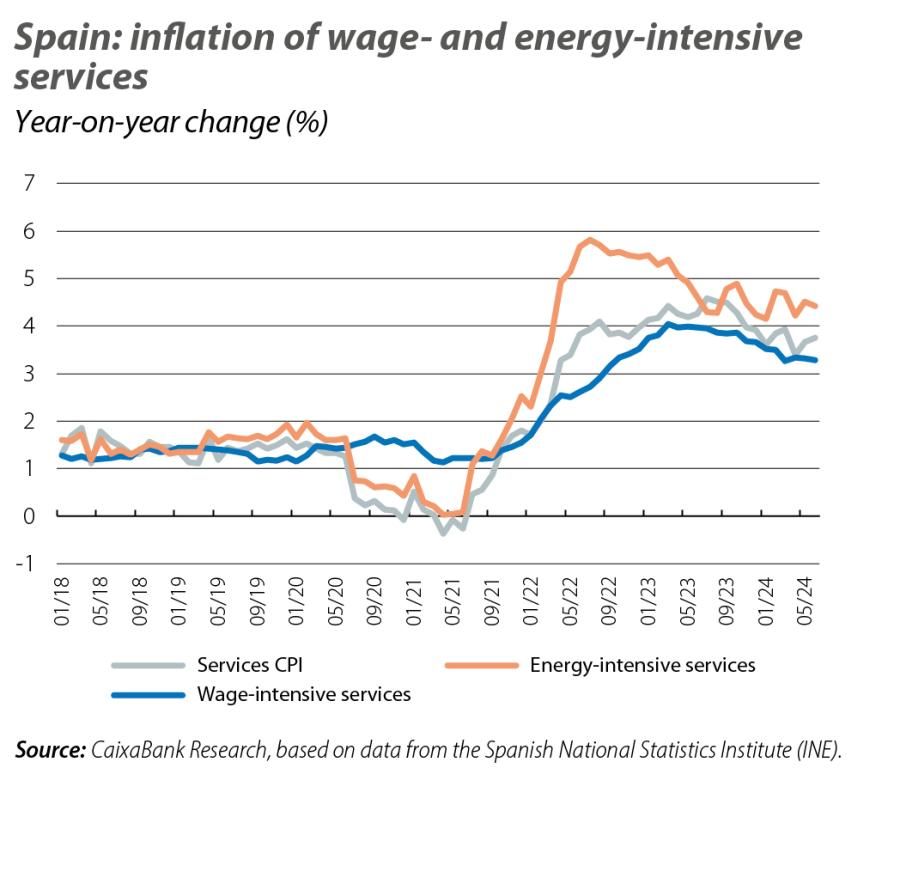
Over the past two years, inflation in energy-intensive services has exceeded the inflation of all services as a whole, while that of wage-intensive services has been lower.5 This gap, which was not present in the period 2018-2019, suggests that energy costs account for a significant part of the rise in services inflation.
Our forecast is that services inflation will moderate over the coming months, standing slightly above 3%. On the one hand, the containment of wage growth reduces the likelihood of second-round effects. On the other hand, the moderation in the pace of growth in tourism demand and the stabilisation of energy prices should also relieve pressure on the prices of tourism services.
- 5For further details, see «Decomposing HICPX inflation into energy-sensitive and wage-sensitive items». ECB Economic Bulletin, Issue 3/2024.

