Spanish households and businesses continue to deleverage
Having overcome the crisis triggered by the pandemic, which caused debt-to-GDP levels to skyrocket, debt ratios have now resumed the downward trajectory they were on prior to COVID. In particular, in the private sector, both businesses and households already have lower levels of debt than before the pandemic and much lower than they had during the financial crisis of 2008. All this, together with the greater weight of fixed-rate debt, puts them in a less vulnerable position to cope with the rise in interest rates.

The total debt of the Spanish economy1 increased by 0.6% quarter-on-quarter (21.5 billion euros) in Q1 2023 to 3.71 billion, although relative to GDP it fell by 5.3 points to 272.8%, the lowest ratio since Q1 2009, due to the significant increase in nominal GDP. This decrease in overall levels of debt has been driven exclusively by the non-financial private sector (households and businesses), since general government debt2 rose slightly to 131.9% of GDP, although it is still close to its lowest levels since 2013.
- 1. Debt in the form of debt securities and loans. Also, the debt of the economy as a whole does not include financial institutions in order to avoid double counting.
- 2. The concept of general government debt used in the Financial Accounts is broader than that used by the European Commission for the purposes of the Excessive Deficit Procedure (EDP): the latter, which stood at 113.0% of GDP in Q1 2023, includes the gross obligations of general government institutions in the form of cash and deposits, debt securities (at face value, not market value) and loans; it does not include the liabilities of general government institutions that are held by other such institutions, trade payables or other amounts payable.

In the case of households and businesses, their debt fell by 28.4 billion euros to a total of 1.92 billion, equivalent to 140.9% of GDP (146.6% at the close of 2022); in consolidated terms (excluding debt between companies, since in many cases this corresponds to holdings between parent and subsidiary companies), private debt stood at 121.1% (125.4% previously), so it remains below the threshold set by the European Commission in the Macroeconomic Imbalance Procedure (MIP).3 Indeed, we have to go back almost 20 years (to Q2 2003) to find a lower ratio.
Next, we will analyse the financial flows and balances of households and businesses in more detail.
- 3. A supervision mechanisms intended to prevent and correct macroeconomic imbalances in EU countries by monitoring 14 different indicators which trigger a warning when certain thresholds are surpassed; in the case of consolidated private debt, this threshold is set at 133% of GDP.
Households continued to deleverage in Q1 2023, reducing their debt by 7,866 million euros (–1.1%), placing it at 694,938 million. This amount represents 51.1% of GDP, 2 points less than in the previous quarter and the best figure since 2002. Due to the rise in interest rates, households continued the trend initiated in the second half of 2022 and used their pent-up savings to make net payments on their bank loans of 7,268 million euros: this is the most negative flow in Q1 since 2014, which contrasts with the net increase in lending in Q1 2022 (443 million) and exceeds the average for the same period in 2014-2019 (–4,956 million).4
- 4. In addition to the decline in new lending observed since last summer, especially in the home acquisition loan segment, there has been an increase in the repayment of mortgages, essentially driven by variable-rate loans, the cost of which has risen sharply. See Bank of Spain (2023). «Report on the Financial Situation of Households and Firms. First half
of 2023».


As for the households’ net acquisition of financial assets, in Q1 2023 it was negative (–5,468 million euros), something not seen in a first quarter since 2017. Essentially, households reduced their cash holdings (–1,442 million euros vs. –2,719 million on average in 2014-2019) and, above all, their bank deposits (–20,776 million vs. –941 million); on the other hand, they invested 9,534 million euros in debt securities and 9,518 million in equities and investment funds.

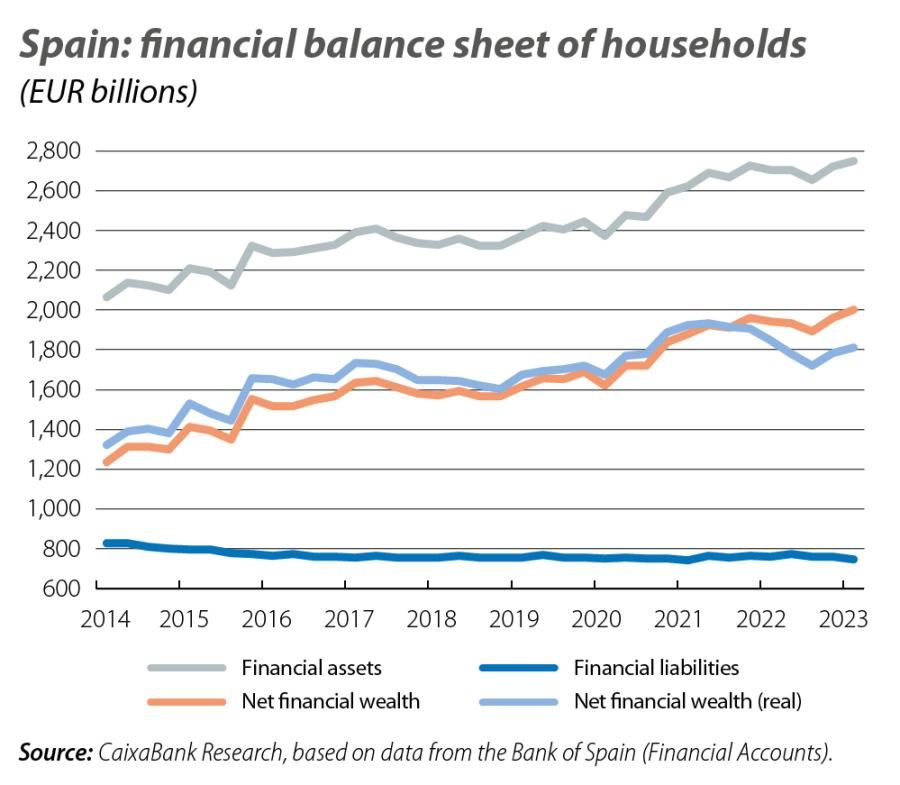
The negative acquisition of assets was largely offset by their strong appreciation (34,897 million euros), mainly due to improvements in the valuations of equities and investment fund holdings. Thus, the stock of households’ gross financial assets grew by 29,357 million euros to a total of 2.75 billion.
With regard to the composition of household financial wealth, we are witnessing a restructuring, as the relative weight of cash and deposits is reduced and instruments with a higher expected return, such as Treasury bills and investment funds, gain prominence. Thus, equities and investment funds accounted for 45.4% of households’ total financial assets, the highest percentage since 2017 (43.0% in 2014-2019), while the role of cash fell to an all-time low (2.0% vs. 3.1% before the pandemic). Insurance policies and pension funds, meanwhile, are making a timid recovery after a long decline, although they remain close to their lowest levels since 1999 (12.5%).

As a result of the increase in financial assets discussed above, together with the fall in total liabilities5
(–11,380 million euros), the net financial wealth of households has increased by over 40,736 million compared to the previous quarter, bringing the overall figure to just over
2 trillion euros, a new all-time high.
The fact that, at the aggregate level, households are improving their equity position is not incompatible with the difficulties that some segments are experiencing, such as households with variable-interest-rate debts
or those with lower incomes.6
- 5. In addition to the balance of outstanding bank loans, this includes trade payables and other amounts payable (accrued interest on loans, taxes payable and outstanding social security contributions).
- 6. In addition to the balance of outstanding bank loans, this includes trade payables and other amounts payable (accrued interest on loans, taxes payable and outstanding social security contributions).


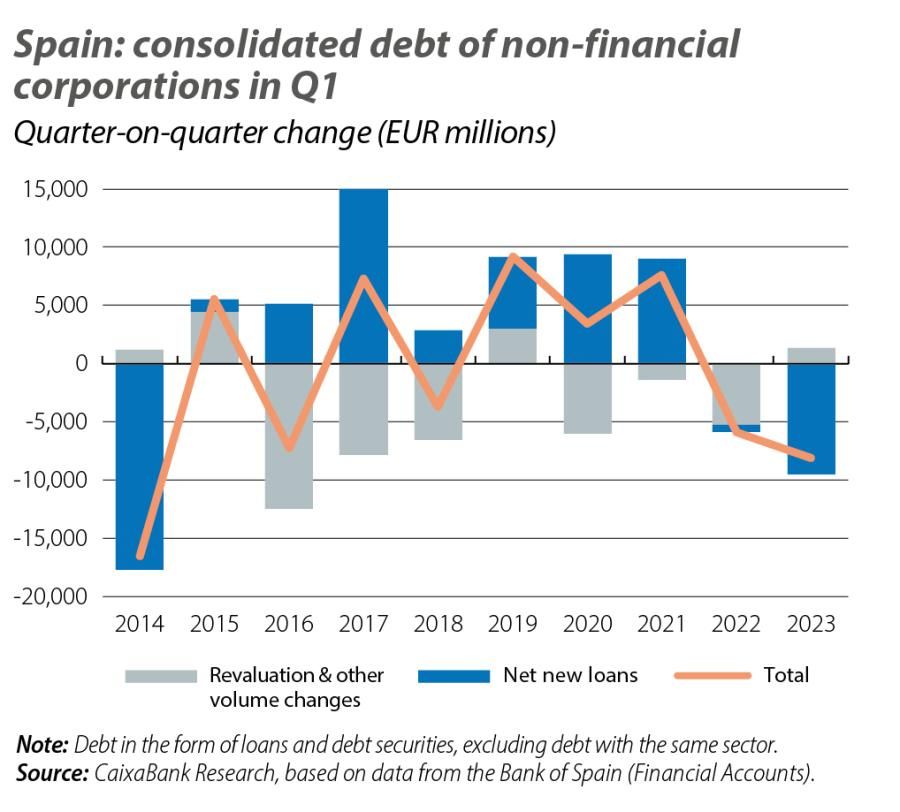
The net debt contracted by non-financial corporations (in consolidated terms) fell in the first three months of the year by 9,468 million euros, marking the biggest repayment in a first quarter since 2014 (–603 million in Q1 2022 and +2,121 million on average in 2014-2019). If we deduct a slight increase in the prices of fixed-income securities, along with other changes in volume, then the balance of consolidated corporate debt contracted by 8,116 million euros (–0.8%) to a total of 952,696 million;
in terms of GDP, this is equivalent to 70%, the lowest ratio since Q3 2003.
As for corporations’ financial assets, they increased slightly in Q1, by just 7,181 million euros (up to 3.03 billion). This marks an improvement on the figure of a year earlier (–76,766 million), but it is well below the
2014-2019 average (51,565 million). This increase in the asset balance is explained entirely by the significant appreciation in their value (37,600 million), especially in the case of equities and investment funds, since the net acquisition of assets was negative (–30,724 million), as has been frequently the case in the first quarter of recent years: firms reduced their assets held in the form of trade receivables, loans and, above all, cash and deposits.

